DeepBrain Metabase: feature parity and decisions
Connected dashboard practice: Start with the guided walkthrough; this chapter keeps the deeper feature and analysis reference.
The first four dashboards are now joined by a reusable metric library and three relationship explorers. This is a separate DeepBrain database (3), collection (17), and local SQLite file. SORI remains on its original connection and collections. Both use the same authorized local Metabase server; this is not a separate Metabase installation or cloud account.
Start with one decision, not every dashboard. “Did this customer complete quality work and use it?” is the proposed value question. Then inspect review coverage, failure recovery, human effort and full service cost before recommending growth.
What was adapted from SORI
| SORI capability | DeepBrain equivalent | Why it differs |
|---|---|---|
| Canonical metric dictionary and implementation registry | DB01–DB32, 27 reusable metric objects, one exact percentile analysis, four instrumentation gaps | Completed video work and audience use replace music playback and music learning |
| Reusable source models and metric-backed views | 13 models and 27 views using shared metric references | Account, signup, task, entitlement, review, evaluation and monthly cash grains stay distinct |
| Workflow stage collections and tabbed metric library | Eight stages plus Overview; nine tabs | Final stage covers adoption and missing measurement, not musical pedagogy |
| Described metric dimensions and chart fields | Model metadata, metric dimensions and raw-table fields described | Persona is fictional job context; no invented demographic profile |
| Relationship/definition selector | Three North Star choices: quality use, ready output, export | Download or rendering is weaker evidence than approved audience use |
| Recorded task journey and audit | Timestamp-ordered Sankey, missing review and recovery audit | Review and export can occur in parallel; skips remain visible |
| Mature cohort and first-week signal explorers | Eight growth views including zero-task signups | Seven-day exposure and days 28–41 quality-use return fit this practice journey |
| Calibration and baseline prediction check | Earlier complete mature months train; latest complete mature month held out | Actual held-out return is required; prediction alone proves no improvement |
| Economics, pricing and ledger drilldowns | Direct cost per quality-use task, service cash contribution, MRR bridge, separate entitlement meters | Video counts, dubbing minutes and generative credits cannot be pooled |
| Evaluation slices and judge failure analysis | Paired held-out cases by candidate/slice and independent synthetic expert labels | No current production model or internal evaluation system is asserted |
| Connected tables, evidence inspection and editable SQL | 27 detected foreign-key relationships; task evidence Q15, models, standalone SQL/CSV/notebooks | Child costs and attempts are preaggregated before task-level joins |
| Filters and explanations | Four operational dashboards plus three explorers with mapped filters; visible decision/boundary notes | Library tiles intentionally use full frozen snapshot without misleading global filters |
No music-specific metrics, MIDI observations, learner-gain proxies, GPU-capacity model, token-billing architecture or geographic distributions were copied. Those are not evidenced DeepBrain production details. Adding invented tables just to match SORI's count would weaken the practice.
Public research behind the model
AI Studios markets document-to-video, translation/dubbing, team/enterprise workflows and API generation. Those surfaces motivate three fictional workflow labels: document_avatar, dubbing and api_template. Public pricing presents distinct allowances, which motivates a meter-specific entitlement ledger, not an assertion about their actual billing implementation. Enterprise/customer pages motivate creator, reviewer, buyer and operator handoffs. The role explicitly asks for metric-led improvement and B2B pricing/conversion experience. See company/role, workflows and competitors and source ledger for evidence and access limits.
The causal chain “faster recovery → more quality use → return → renewal” is a proposed strategy. Only fixed-population arithmetic identities are labeled identities. The fictional early-value/return comparison is a descriptive association. No private company revenue, customer mix, architecture or experiment result was learned from this database.
How the tables connect
Accounts contain users; users create tasks. Tasks have zero or more attempts, zero or more cost lines, at most one retained output and review, and one entitlement record where recorded. Support tickets attach to tasks. Billing is account-month, period costs are month-component. Evaluation cases pair candidate rows on the same held-out case. Public reference, observed access checks, synthetic simulation, proposed plans and blank personal practice records have explicit separate tables/provenance.
Never join billing directly to task costs and then sum revenue. Aggregate each to the intended month/account grain first. Never multiply task rates into unique-account counts. Never average workflow p95s to estimate an overall p95. The exact Q07 percentile SQL sorts end-to-end task durations and uses nearest ranks; it is not misrepresented as a freely additive metric object.
Scope and controls
The metric library uses the entire frozen snapshot unless the question is filtered. Its weekly model excludes incomplete edge weeks; financial models exclude the cutoff's incomplete current month. It is deliberately different from operational dashboards' default May 1–October 1 window. Metric-backed questions can be filtered using their documented dimensions. Preserve month, week, meter, workload component and candidate/slice grouping.
Operational dashboards use persona, workflow/primary intent, signup month and dates where relevant. Financial cards use whole-month date filters; offline evaluations and planning do not respond to customer filters. Relationship explorers use definition, persona and early/task workflow. Growth workflow filters only first-week exposure: all mature persona signups remain in the denominator, including no filtered task, and later quality return covers any workflow.
The explorer's quality exposure requires both confirmed use and its acceptance review before day seven. Later return uses the existing canonical day28–41 quality-use definition at the frozen cutoff. This is not activated-user retention, account renewal or learning retention.
Start with these decisions
- Compare quality accounts with export accounts. Ask whether apparent growth is delivery volume or confirmed customer value.
- Follow recorded paths and inspect unknown reviews before claiming abandonment.
- Compare mature first-week groups, then inspect counts and the held-out prediction error. Propose an account-level randomized intervention; Q13 shows why user assignment can mix treatments within a team.
- Keep review/repair work, direct vendor cost, full service cash contribution and trust gaps beside the growth recommendation.
Local dashboards
- Metrics Library and Decision Stages
- Strategy relationship explorer
- Journey relationship explorer
- Growth relationship explorer
These links reach the Mac running Metabase. The published website does not expose the local database or credentials. Download the SQL/CSV/notebook for offline analysis. A phone can read the published guide but cannot reach the Mac through 127.0.0.1.
Explorer analysis and spoken practice
N01 · Compare weekly account-value definitions
Decision: Weekly distinct accounts, anchored to each milestone time. Full UTC weeks only. Ready/export alternatives do not redefine DB01 or prove audience value. Missing confirmations undercount.
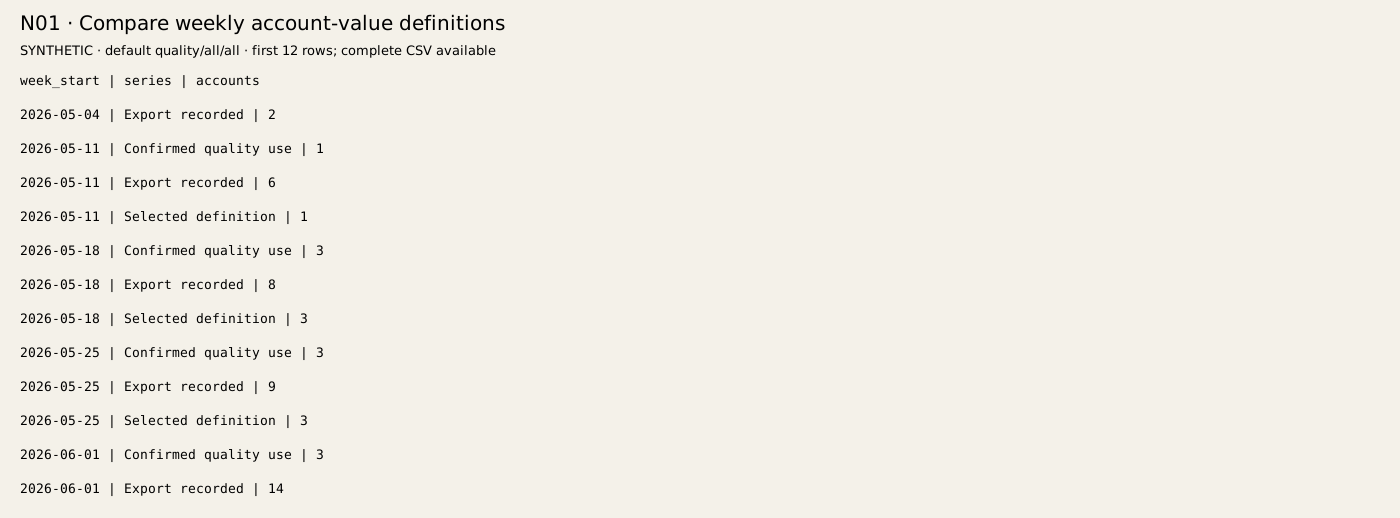
Default fictional output has 70 rows. First evidence: week_start=2026-05-04, series=Export recorded, accounts=2; week_start=2026-05-11, series=Confirmed quality use, accounts=1
Full CSV · Exact parameterized SQL
Say: “I would use confirmed quality-use accounts as the proposed North Star and keep exports as a diagnostic. Exporting a video does not tell us whether an approved version reached its audience. I would first test confirmation coverage before interpreting the gap as poor value.”
N02 · Task drivers and review coverage
Decision: Task fractions use stated denominators. These are candidate drivers, not additive contributions to distinct-account North Star value. Missing reviews are unknown.

Default fictional output has 4 rows. First evidence: driver=Render completion / all tasks, fraction=0.80154; driver=Selected value / all tasks, fraction=0.17
Full CSV · Exact parameterized SQL
Say: “In this fictional snapshot, render completion is about 80 percent while confirmed quality use is 17 percent. I would investigate the post-render handoff, but the gap also contains missing confirmation and review. I would inspect representative task records before choosing a redesign.”
N03 · Explain metric relationships and guardrails
Decision: Links are labeled identities, descriptive associations or hypotheses. Arrows are not causal weights; selected definition is a practice alternative.
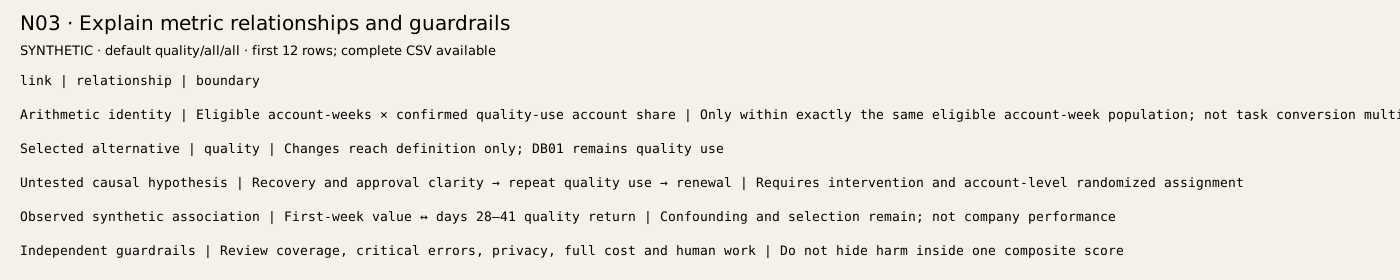
Default fictional output has 5 rows. First evidence: link=Arithmetic identity, relationship=Eligible account-weeks × confirmed quality-use account share, boundary=Only within exactly the same eligible account-week population; not task conversion multiplication; link=Selected alternative, relationship=quality, boundary=Changes reach definition only; DB01 remains quality use
Full CSV · Exact parameterized SQL
Say: “I would keep the value chain visible without pretending the arrows are proven. Within one account-week population, eligible accounts times the quality-use share gives quality-use accounts. Recovery leading to renewal is a hypothesis that needs a separate intervention test.”
J01 · Recorded task paths and recovery endpoints
Decision: Widths are tasks. Events ordered by recorded time; review and export are parallel, not forced into a funnel. Missing events are skipped. Terminal state is not proven abandonment. Before-creation timestamps excluded in J02.
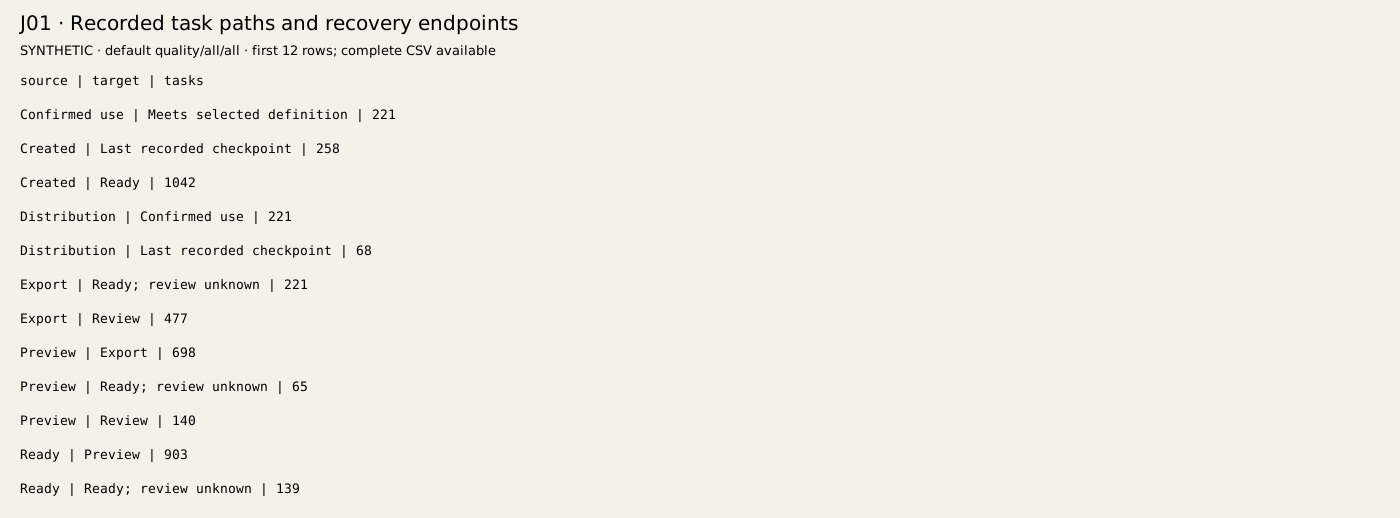
Default fictional output has 14 rows. First evidence: source=Confirmed use, target=Meets selected definition, tasks=221; source=Created, target=Last recorded checkpoint, tasks=258
Full CSV · Exact parameterized SQL
Say: “I would follow the recorded path to find where evidence stops, rather than force review and export into one funnel. A direct link may mean a skipped event. I would inspect the task evidence and operator workflow before calling that point abandonment.”
J02 · Chronology, missing review and recovery audit
Decision: Inspect audit counts before interpreting flow. Failed attempts can recover within one task. Unreviewed ready output is unknown quality, not rejected output.

Default fictional output has 1 rows. First evidence: tasks=1300, chronology_excluded=0, ready_review_unknown=425, exports_without_preview=0, tasks_with_failed_attempt=193, recovered_to_quality_value=6
Full CSV · Exact parameterized SQL
Say: “The fictional audit has 425 ready outputs without a review and 193 tasks with a failed attempt; only six of those tasks later meet quality use. I would separate missing reviews from recovery friction before proposing a retry change. Recent tasks also have less time to recover.”
G01 · First-week exposure to mature quality return
Decision: All mature signups including zero activity. Workflow filters first-week task exposure only; later quality return covers any workflow. Quality early exposure requires review and use before day seven. Association is not causal.
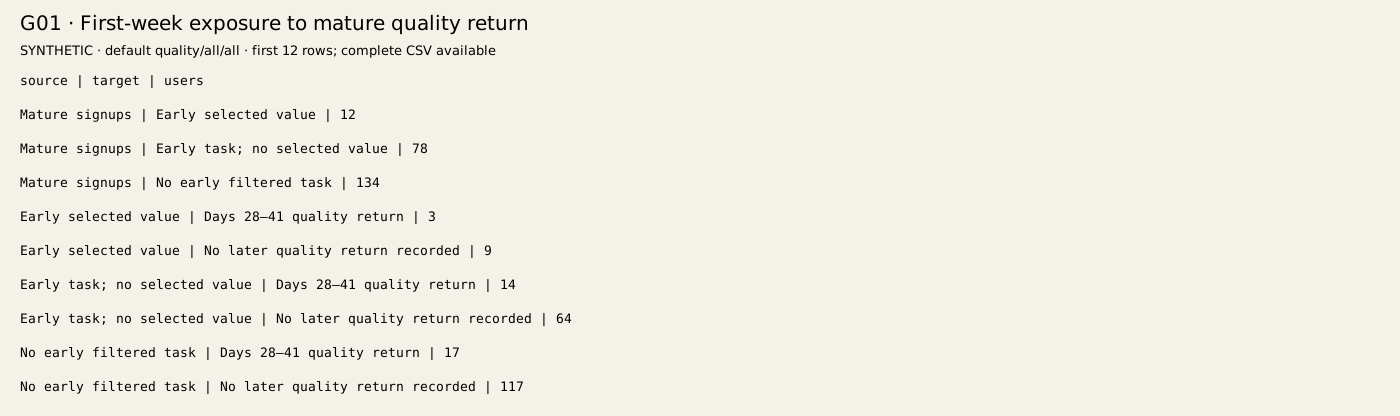
Default fictional output has 9 rows. First evidence: source=Mature signups, target=Early selected value, users=12; source=Mature signups, target=Early task; no selected value, users=78
Full CSV · Exact parameterized SQL
Say: “I would compare later quality return for all mature signups, including users with no first-week task. The workflow control changes early exposure, not the denominator. Any difference suggests an investigation; it does not prove activation caused retention.”
G02 · Signup cohorts and later quality return
Decision: Same mature signup-month denominator and fixed day28–41 outcome. Inspect G03 counts. Latest partially mature signup month is not equivalent to a full-month cohort; prediction excludes it.
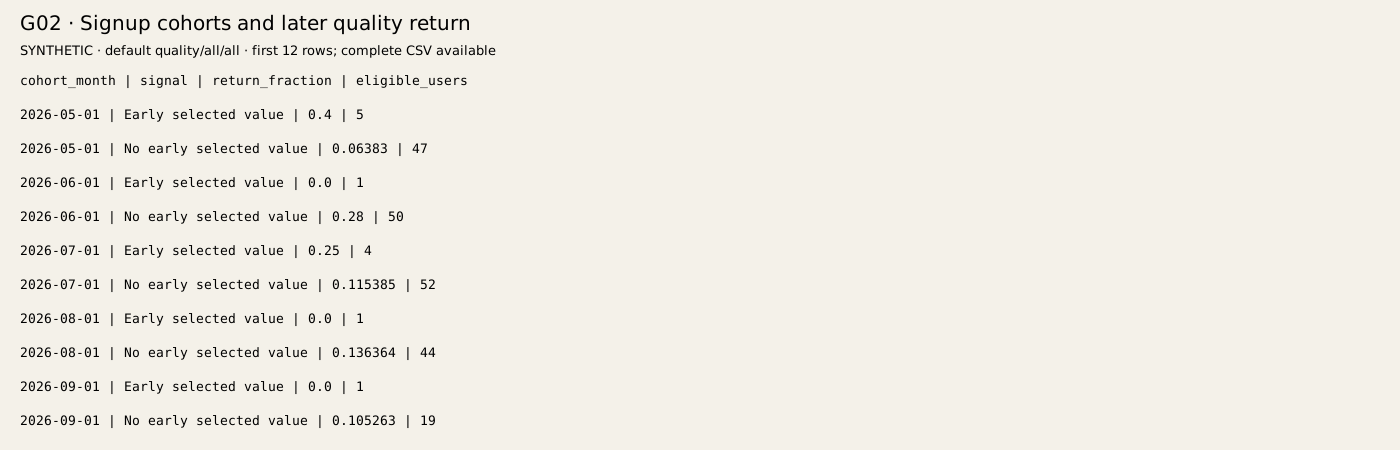
Default fictional output has 10 rows. First evidence: cohort_month=2026-05-01, signal=Early selected value, return_fraction=0.4, eligible_users=5; cohort_month=2026-05-01, signal=No early selected value, return_fraction=0.06383, eligible_users=47
Full CSV · Exact parameterized SQL
Say: “I would compare early-value groups within the same mature signup month, then check the counts. Mixing months can hide acquisition changes. I would avoid treating the partially mature latest signup month as a complete cohort.”
G03 · Cohort counts and uncertainty
Decision: Counts precede rates. Standard error is a descriptive binomial approximation; small groups and clustered team accounts weaken independence. No treatment effect or company baseline.
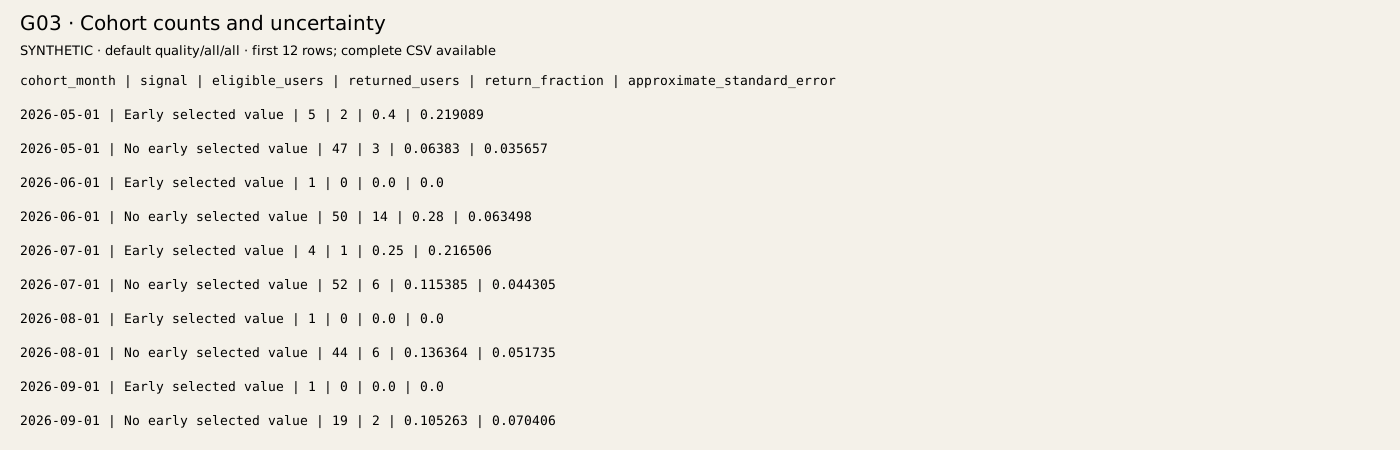
Default fictional output has 10 rows. First evidence: cohort_month=2026-05-01, signal=Early selected value, eligible_users=5, returned_users=2, return_fraction=0.4, approximate_standard_error=0.21909; cohort_month=2026-05-01, signal=No early selected value, eligible_users=47, returned_users=3, return_fraction=0.06383, approximate_standard_error=0.03566
Full CSV · Exact parameterized SQL
Say: “I would lead with the eligible and returned user counts before the percentage. Sparse groups and shared team accounts make the uncertainty larger than a simple chart suggests. I would collect another mature cohort before making a rollout decision.”
G04 · Early task bands versus later return
Decision: Each point is an activity band, not a person. Aggregation can conceal user differences. Zero-task signups remain. Use counts and persona slices before proposing a test.

Default fictional output has 4 rows. First evidence: task_band=0, mean_early_value_tasks=0.0, return_fraction=0.12687, eligible_users=134; task_band=1, mean_early_value_tasks=0.06897, return_fraction=0.18966, eligible_users=58
Full CSV · Exact parameterized SQL
Say: “These points are activity bands, not individual users. A band with more early value and more later return could reflect stronger initial intent. I would inspect user rows and persona mix before proposing an account-level randomized intervention.”
G05 · Weekly early signal and later outcome
Decision: Both lines use the same mature signup-week users. Shared trends can reflect acquisition mix or seasonality; they do not prove leading-signal causality. Edge signup weeks can be partial.
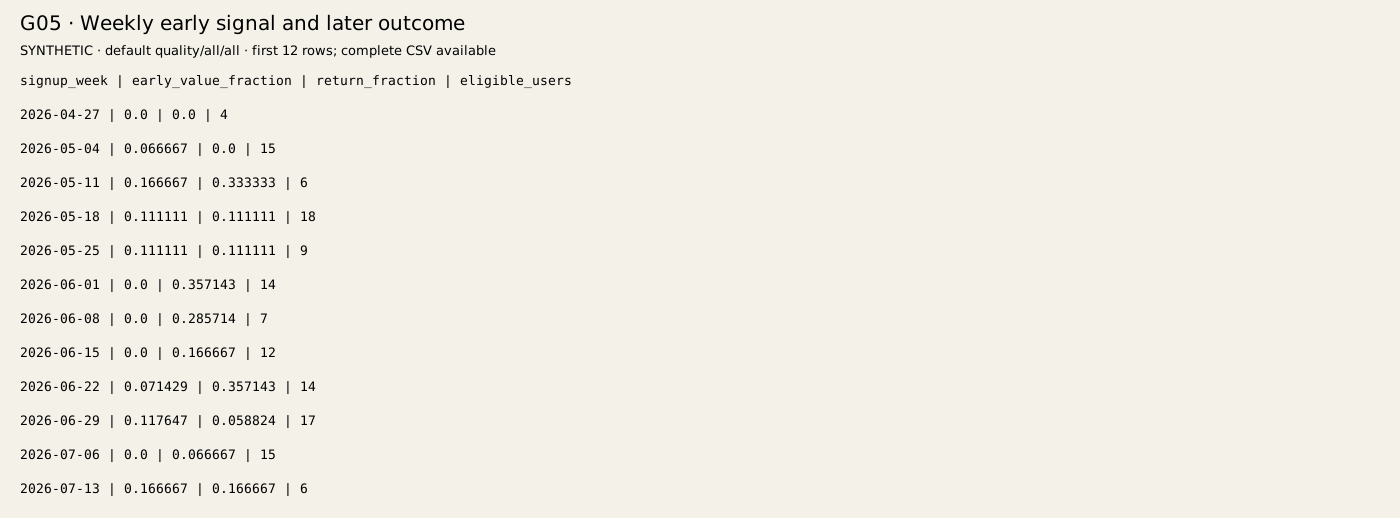
Default fictional output has 20 rows. First evidence: signup_week=2026-04-27, early_value_fraction=0.0, return_fraction=0.0, eligible_users=4; signup_week=2026-05-04, early_value_fraction=0.06667, return_fraction=0.0, eligible_users=15
Full CSV · Exact parameterized SQL
Say: “The two lines describe the same mature signup-week cohorts, so they are useful for checking whether the pattern repeats. Their moving together does not establish causality. I would inspect cohort counts and acquisition mix before choosing a test.”
G06 · Held-out signal calibration
Decision: Earlier complete mature signup months train group probabilities; latest complete mature month is held out. Missing train group produces null, not zero. Compare actual held-out outcomes; predictions alone prove no improvement.

Default fictional output has 2 rows. First evidence: signal=Early selected value, heldout_users=1, training_users=10, predicted_return=0.3, actual_return=0.0; signal=No early selected value, heldout_users=44, training_users=149, predicted_return=0.15436, actual_return=0.13636
Full CSV · Exact parameterized SQL
Say: “I would not trust this calibration result yet: the early-value held-out segment contains one user. Its actual outcome can move the rate from zero to one. I would retain the base-rate forecast and collect a larger future cohort before using the signal operationally.”
G07 · Held-out prediction versus training base rate
Decision: Brier error uses actual held-out outcomes. Lower is better. Baseline and signal score exactly the same covered users; positive difference favors the signal. Synthetic exercise, no deployment or causal improvement claim.

Default fictional output has 1 rows. First evidence: heldout_users=45, scored_users=45, signal_brier=0.11747, baseline_brier=0.11647, brier_improvement=-0.001
Full CSV · Exact parameterized SQL
Say: “The first-week signal does not beat the training base-rate prediction in this fictional held-out cohort. Its Brier error is about 0.1175 versus 0.1165, where lower is better. I would not claim predictive lift or causal improvement; I would test a better-defined signal on new evidence.”
G08 · Inspect mature user evidence rows
Decision: One row per mature signup; joins retain zero early activity. Workflow filters early exposure, not user eligibility or later any-workflow return. Inspect row evidence before claiming activation predicts renewal.
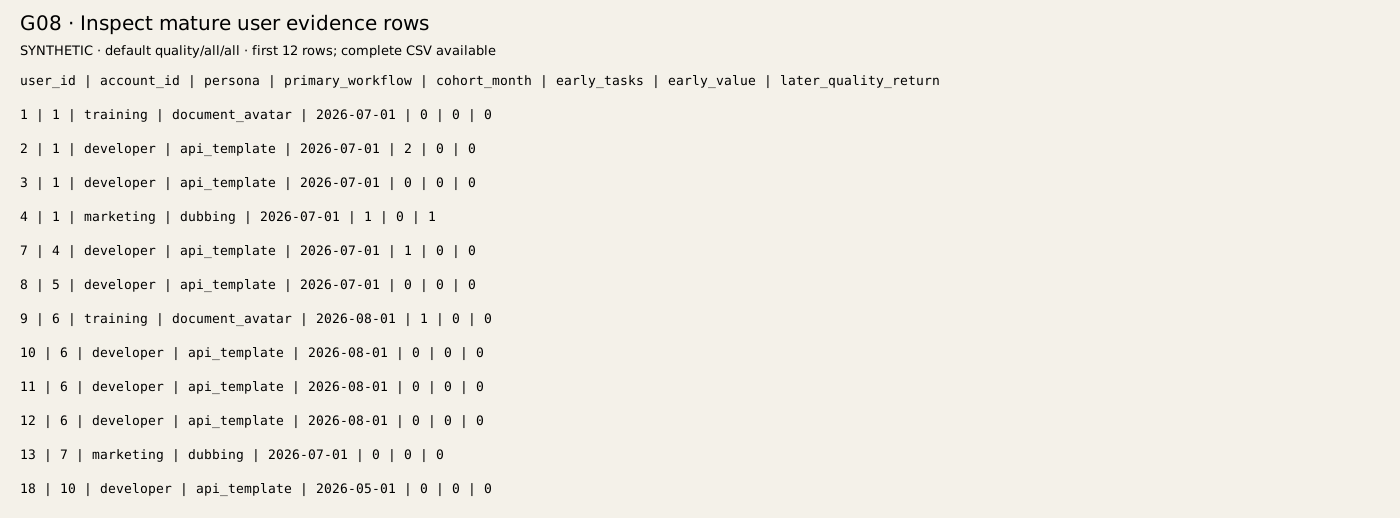
Default fictional output has 224 rows. First evidence: user_id=1, account_id=1, persona=training, primary_workflow=document_avatar, cohort_month=2026-07-01, early_tasks=0, early_value=0, later_quality_return=0; user_id=2, account_id=1, persona=developer, primary_workflow=api_template, cohort_month=2026-07-01, early_tasks=2, early_value=0, later_quality_return=0
Full CSV · Exact parameterized SQL
Say: “I would inspect one mature user row to explain the denominator and exposure window. Zero early tasks in the selected workflow is different from no activity anywhere. That distinction matters before I recommend onboarding or customer-success outreach.”