E09 · Cost of useful work
Synthetic practice, not company performance.
One decision
What changes cost per useful result most?
Run the exact query
WITH b AS (SELECT * FROM v_task WHERE ('all'='all' OR persona='all') AND ('all'='all' OR workflow='all') AND ('all'='all' OR substr(signup_at,1,7)='all') AND date(created_at)>='2026-05-01' AND date(created_at)<'2026-10-01') SELECT workflow,COUNT(*) tasks,SUM(confirmed_quality_use) useful_tasks,SUM(direct_vendor_usd) direct_vendor_usd,SUM(direct_vendor_usd)/NULLIF(SUM(confirmed_quality_use),0) usd_per_confirmed_use FROM b GROUP BY workflow;
Download SQL · Result CSV · Metabase saved question
Chart and reading
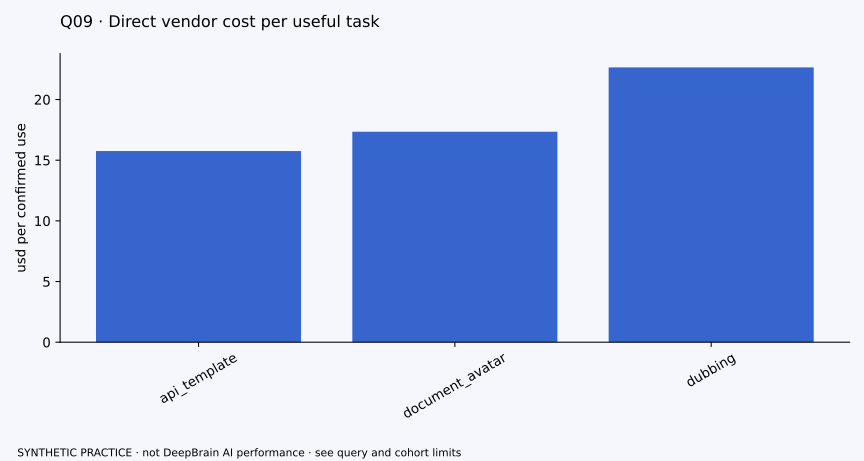
Include failed/nonmonetized attempts and compare all service scopes.
Challenge your recommendation
Does low confirmation coverage inflate the denominator problem?
Guardrails: Includes all selected task costs incl failures; excludes period allocations, shown separately Q18. Review is vendor fraction; customer time separate.
Next evidence: Real invoices, provider rates, vendor/customer labor split and stable use-confirmation sampling.
PRD sections: 2, 14. Open proposed PRD
Your spoken decision
State one takeaway, one caveat and one action in 30 seconds. Then stop.
Connect this finding
What this chart helps decide · Follow the connected decision · Canonical metric definitions
Optional model answer — try your own first
E09 · Cost of useful work
Decision: What changes cost per useful result most?
Readout: Include failed/nonmonetized attempts and compare all service scopes.
Actual query output (synthetic), first rows:
| workflow | tasks | useful_tasks | direct_vendor_usd | usd_per_confirmed_use |
|---|---|---|---|---|
| api_template | 390 | 79 | 1244.62214 | 15.754710632911392 |
| document_avatar | 373 | 62 | 1075.3534319999999 | 17.344410193548384 |
| dubbing | 318 | 43 | 973.881924 | 22.648416837209304 |
Model spoken answer: I would reduce the verified cost driver per useful task, with quality and full period cost as guardrails.
Caveat/counterargument: Does low confirmation coverage inflate the denominator problem? Includes all selected task costs incl failures; excludes period allocations, shown separately Q18. Review is vendor fraction; customer time separate.
Next evidence: Real invoices, provider rates, vendor/customer labor split and stable use-confirmation sampling.
Deliberately left out: Calling the direct-cost ratio gross margin.