# Walk through the DeepBrain metrics as one decision
**Start with the customer outcome, then follow the evidence.** The proposed outcome is an account getting accurate, approved video work to its audience. This tour connects the dashboards to the product workflow, metric definitions, PRD and your spoken answers.
All operating numbers below are **synthetic practice**, and the opportunity/release records are **proposed planning**. They are not DeepBrain performance, official targets or your historical accomplishments. Examples were refreshed from the saved Metabase questions and checked against SQLite on 23 October 2026.
For a quick session, follow the eight stops and open only their suggested charts. For a specific question, use the chart decision catalog. Optional figures, data tables and SQL stay below the main explanation.
**The connection:** useful audience work → repeated quality work → commercial outcomes, with quality, privacy, customer effort and full cost checked alongside. These links are hypotheses until tested; fixed-population arithmetic is labeled separately.
## How the metrics connect
The customer story is: **create → recover/prepare → review → approved audience use → repeated quality work → renewal/expansion**. Review and export can occur in parallel. The arrows describe a workflow and hypotheses, not a validated causal model.
| Connection | What we can say | What we cannot conclude |
|---|---|---|
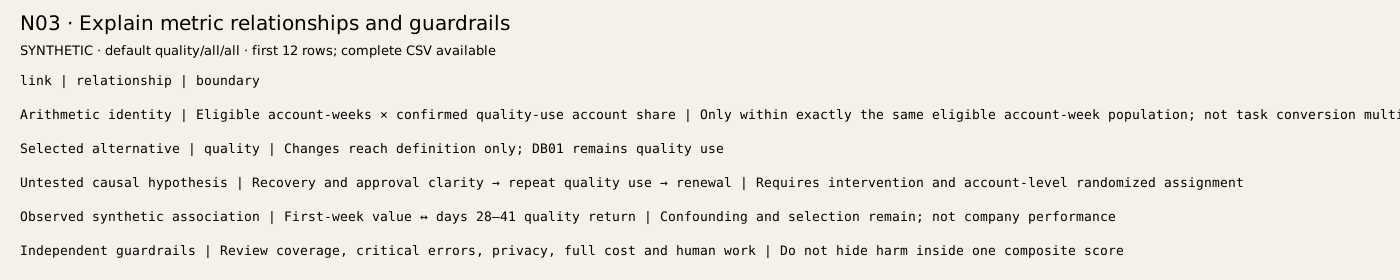
| Eligible account-weeks × quality-use account share → quality-value accounts | Arithmetic identity within exactly the same eligible account-week population | Multiplying task conversion rates reproduces distinct accounts |
| Render completion → review → confirmed quality use | Recorded milestones expose handoffs and missing evidence | Every customer must traverse the columns in one sequence |
| Early quality value ↔ days 28–41 return | Descriptive association in fictional signup cohorts | Onboarding caused retention or forecasts will improve |
| Held-out signal vs base-rate prediction | Actual future-cohort outcomes allow an error comparison | A predicted baseline alone establishes improvement |
| Repeat value → renewal/expansion | Plausible commercial hypothesis to test at account level | The dataset estimates the causal revenue effect of a product change |
| Costs/quality/privacy/human work alongside value | Independent guardrails can stop a proposal | One rising North Star compensates for a critical failure |
[See the relationship map](/strategy/) · [Customer workflow](/product/) · [Metric dictionary](/metrics/)
## Set the population before reading a number
**Operational dashboards 7–10:** use persona/workflow/signup month “all”; From **2026-05-01**, inclusive; To **2026-10-01**, exclusive. Task cards filter creation dates, signup cards filter signup dates, and Q01 uses complete confirmed-use weeks. Financial cards use full calendar months; offline evaluation and planning ignore customer filters by design.
**Relationship explorers 12–14:** select **quality**, persona **all**, workflow **all**. They use the **full frozen snapshot** at 23 October 2026 00:00 UTC. Growth workflow filters first-week task exposure only; all mature persona signups remain in the denominator and later return can occur in any workflow. Quality exposure needs both review and use before day seven. The prediction test uses only complete mature signup months.
**Library dashboard 11:** reusable metrics use their documented full-snapshot models, without global dashboard filters. Retain week, month, meter, workload component and candidate/slice grouping. A ratio of 0.25 means 25%; many operational charts already display percentages. These populations differ, so do not copy a number from one view into another without matching scope.
Metabase may remember your last filter. The links in this tour specify the example controls explicitly. Local Metabase opens on this Mac; it is not embedded or exposed through the public website. The guide's figures are downloadable snapshots, not live Metabase filters.
## Stop 1: Choose the customer outcome
**Question:** Are we counting useful work or just generated output?
Use weekly accounts with accepted, no-critical-error work and confirmed audience use as a proposed North Star. Keep review coverage beside it.
**Open:** [Dashboard 12](http://127.0.0.1:3000/dashboard/12?definition=quality&persona=all&workflow=all) · [Dashboard 7](http://127.0.0.1:3000/dashboard/7?persona=all&workflow=all&cohort=all&from_date=2026-05-01&to_date=2026-10-01) · [Dashboard 11](http://127.0.0.1:3000/dashboard/11)
**Follow these charts:** [Read Q01](#chart-Q01) → [Read N01](#chart-N01) → [Read N02](#chart-N02) → [Read N03](#chart-N03)
**Say this in about 20–30 seconds:**
> I would measure weekly accounts completing quality work that is actually used. Exports help diagnose delivery, but they do not establish audience value. I would validate confirmation coverage before interpreting a change.
**STOP.** Let the interviewer request the next detail.
**Go deeper only if asked:** Choose one chart below. State its eligible population, one observed pattern, its strongest alternative explanation and the next evidence you would collect. Expected impact remains proposed.
**Connected study:** [Customer jobs](/product/) · [Canonical definitions](/metrics/) · [Strategy choices](/strategy/)
**Next:** Once the outcome is clear, find where the delivery-to-use journey needs investigation.
## Stop 2: Find the limiting handoff
**Question:** What should we improve first in the customer journey?
Ready latency is measured in minutes, while review and actual use take much longer in this fictional sample. Investigate workflow ownership and recovery before assuming compute is the main constraint.
**Open:** [Dashboard 8](http://127.0.0.1:3000/dashboard/8?persona=all&workflow=all&cohort=all&from_date=2026-05-01&to_date=2026-10-01) · [Dashboard 13](http://127.0.0.1:3000/dashboard/13?definition=quality&persona=all&workflow=all) · [Dashboard 10](http://127.0.0.1:3000/dashboard/10?persona=all&workflow=all&cohort=all&from_date=2026-05-01&to_date=2026-10-01)
**Follow these charts:** [Read Q02](#chart-Q02) → [Read Q07](#chart-Q07) → [Read Q08](#chart-Q08) → [Read Q23](#chart-Q23) → [Read Q24](#chart-Q24) → [Read J01](#chart-J01) → [Read J02](#chart-J02)
**Say this in about 20–30 seconds:**
> I would investigate the post-render handoff first. Ready latency is minutes, while the selected review-to-use records show waits of hours or days. Those populations differ, so I would inspect the records and test review ownership before committing to a redesign.
**STOP.** Let the interviewer request the next detail.
**Go deeper only if asked:** Choose one chart below. State its eligible population, one observed pattern, its strongest alternative explanation and the next evidence you would collect. Expected impact remains proposed.
**Connected study:** [Workflow and operator roles](/product/) · [Failure/recovery PRD](/prd/) · [Task data grain](/data/)
**Next:** A faster handoff is only valuable if the approved content is accurate and the customer has less repair work.
## Stop 3: Protect quality and customer effort
**Question:** Can we ship this improvement and reduce review safely?
Do not let average pass rates or estimated time savings hide critical errors, a regressing slice or reviewer workload.
**Open:** [Dashboard 10](http://127.0.0.1:3000/dashboard/10?persona=all&workflow=all&cohort=all&from_date=2026-05-01&to_date=2026-10-01)
**Follow these charts:** [Read Q06](#chart-Q06) → [Read Q10](#chart-Q10) → [Read Q19](#chart-Q19) → [Read Q20](#chart-Q20)
**Say this in about 20–30 seconds:**
> I would hold broad rollout until the multi-speaker regression and critical errors are understood. Other evaluation slices improve, but that does not resolve the failing customer case. I would work with engineering and domain reviewers on a bounded retest before reducing review coverage.
**STOP.** Let the interviewer request the next detail.
**Go deeper only if asked:** Choose one chart below. State its eligible population, one observed pattern, its strongest alternative explanation and the next evidence you would collect. Expected impact remains proposed.
**Connected study:** [Evaluation and release gates](/prd/) · [Research limits](/research/) · [Engineering-partnership SBI](/answers/)
**Next:** After protecting quality, ask whether more eligible customers reach and repeat the outcome.
## Stop 4: Connect activation to repeat value
**Question:** Does early value translate into later customer use?
Keep mature signup users, including zero activity, in the denominator. Early-value association is a hypothesis to test, not an intervention result.
**Open:** [Dashboard 9](http://127.0.0.1:3000/dashboard/9?persona=all&workflow=all&cohort=all&from_date=2026-05-01&to_date=2026-10-01) · [Dashboard 14](http://127.0.0.1:3000/dashboard/14?definition=quality&persona=all&workflow=all) · [Dashboard 8](http://127.0.0.1:3000/dashboard/8?persona=all&workflow=all&cohort=all&from_date=2026-05-01&to_date=2026-10-01)
**Follow these charts:** [Read Q03](#chart-Q03) → [Read Q04](#chart-Q04) → [Read Q05](#chart-Q05) → [Read Q16](#chart-Q16) → [Read G01](#chart-G01) → [Read G02](#chart-G02) → [Read G03](#chart-G03) → [Read G04](#chart-G04) → [Read G05](#chart-G05) → [Read G08](#chart-G08)
**Say this in about 20–30 seconds:**
> Early value is associated with later return in the practice data, but only 12 users are in the early-value group. I would keep inactive signups visible, check counts within cohorts and validate the pattern prospectively before saying onboarding caused better retention.
**STOP.** Let the interviewer request the next detail.
**Go deeper only if asked:** Choose one chart below. State its eligible population, one observed pattern, its strongest alternative explanation and the next evidence you would collect. Expected impact remains proposed.
**Connected study:** [Activation and return definitions](/metrics/) · [Prioritization drills](/practice/) · [Acquisition and zero-activity exercises](/exercises/)
**Next:** A promising association must survive a held-out prediction test, and any product intervention needs a valid unit of assignment.
## Stop 5: Challenge the apparent success story
**Question:** How do we know the signal or experiment is trustworthy?
The early signal slightly underperforms a simple held-out base-rate forecast. Mixed variants within team accounts also limit an account-level experiment claim.
**Open:** [Dashboard 14](http://127.0.0.1:3000/dashboard/14?definition=quality&persona=all&workflow=all) · [Dashboard 8](http://127.0.0.1:3000/dashboard/8?persona=all&workflow=all&cohort=all&from_date=2026-05-01&to_date=2026-10-01)
**Follow these charts:** [Read Q13](#chart-Q13) → [Read G06](#chart-G06) → [Read G07](#chart-G07)
**Say this in about 20–30 seconds:**
> I would not claim predictive lift here. On the same 45 held-out users, the signal has slightly higher Brier error than the base-rate prediction. I would keep the simpler forecast and improve the evidence. An intervention would need account-level assignment to avoid team contamination.
**STOP.** Let the interviewer request the next detail.
**Go deeper only if asked:** Choose one chart below. State its eligible population, one observed pattern, its strongest alternative explanation and the next evidence you would collect. Expected impact remains proposed.
**Connected study:** [Observed versus proposed evidence](/research/) · [Data and assignment contracts](/data/) · [Rollout design](/prd/)
**Next:** Even a valid customer improvement must make economic sense without shifting hidden work or risk to someone else.
## Stop 6: Connect value to sustainable economics
**Question:** Should we change price, cost structure or acquisition spend?
Separate customer labor, vendor costs, resource meters, recurring revenue and cash. Growing MRR can coexist with erosion of the opening customer base.
**Open:** [Dashboard 10](http://127.0.0.1:3000/dashboard/10?persona=all&workflow=all&cohort=all&from_date=2026-05-01&to_date=2026-10-01) · [Dashboard 9](http://127.0.0.1:3000/dashboard/9?persona=all&workflow=all&cohort=all&from_date=2026-05-01&to_date=2026-10-01)
**Follow these charts:** [Read Q09](#chart-Q09) → [Read Q11](#chart-Q11) → [Read Q12](#chart-Q12) → [Read Q14](#chart-Q14) → [Read Q17](#chart-Q17) → [Read Q18](#chart-Q18)
**Say this in about 20–30 seconds:**
> I would separate new sales from existing-customer value. September MRR grows in the fictional data while NRR is below 100 percent. Before scaling acquisition, I would inspect renewal causes and full service costs, including the support and review work that dominates this model.
**STOP.** Let the interviewer request the next detail.
**Go deeper only if asked:** Choose one chart below. State its eligible population, one observed pattern, its strongest alternative explanation and the next evidence you would collect. Expected impact remains proposed.
**Connected study:** [Economics and units](/economics/) · [Buyer and pricing research](/product/) · [Commercial metric definitions](/metrics/)
**Next:** Turn the diagnosis into one bounded opportunity with explicit dependencies and release evidence.
## Stop 7: Make one bounded product decision
**Question:** What would you actually do next, and what would change your mind?
Use task evidence and customer research to choose a limited review/recovery test. Proposed effort ranges and unverified gates are planning records, not accomplished outcomes.
**Open:** [Dashboard 7](http://127.0.0.1:3000/dashboard/7?persona=all&workflow=all&cohort=all&from_date=2026-05-01&to_date=2026-10-01)
**Follow these charts:** [Read Q21](#chart-Q21) → [Read Q22](#chart-Q22) → [Read Q15](#chart-Q15)
**Say this in about 20–30 seconds:**
> My proposed next step is a bounded test of review ownership and version-safe approval. I would validate the missing handoff with customers, work with engineering and domain reviewers on the dependency and critical cases, and expand only if confirmed use improves without more errors, workload or cost.
**STOP.** Let the interviewer request the next detail.
**Go deeper only if asked:** Choose one chart below. State its eligible population, one observed pattern, its strongest alternative explanation and the next evidence you would collect. Expected impact remains proposed.
**Connected study:** [Bounded localization PRD](/prd/) · [Strategy stack](/strategy/) · [Personal evidence map](/evidence/)
**Next:** Stop after the recommendation and success test. Let the interviewer choose the next level of detail.
## Stop 8: Explain it clearly, then stop
**Question:** Can you extract the main point without narrating every dashboard?
One takeaway, one caveat, one action. Use historical SBI only for your real experience; these tables support hypothetical decision practice.
**Open:** [Dashboard 11](http://127.0.0.1:3000/dashboard/11)
**Say this in about 20–30 seconds:**
> I would prioritize the handoff from generated video to reviewed audience use. The practice data suggest that human review and recovery deserve investigation, but they do not prove the cause. I would test one bounded change with customer-use, quality, workload and cost measures.
**STOP.** Let the interviewer request the next detail.
**Go deeper only if asked:** Choose one chart below. State its eligible population, one observed pattern, its strongest alternative explanation and the next evidence you would collect. Expected impact remains proposed.
**Connected study:** [20–30-second and 60–90-second SBI answers](/answers/) · [Sourced ownership and limits](/evidence/) · [Practice rubric and stopping rule](/practice/)
**Next:** STOP. If asked for your experience, choose one sourced Rakuten, Edugo or KidsLoop example from the answer bank.
## Chart decision catalog
Each entry has one question, one finding, one caveat, one next action and a natural stopping point. The saved question opens in local Metabase with the example controls. The downloadable chart/data/SQL are available on any device. Read counts before percentages. Numerical snapshots do not change when you change a Metabase filter.
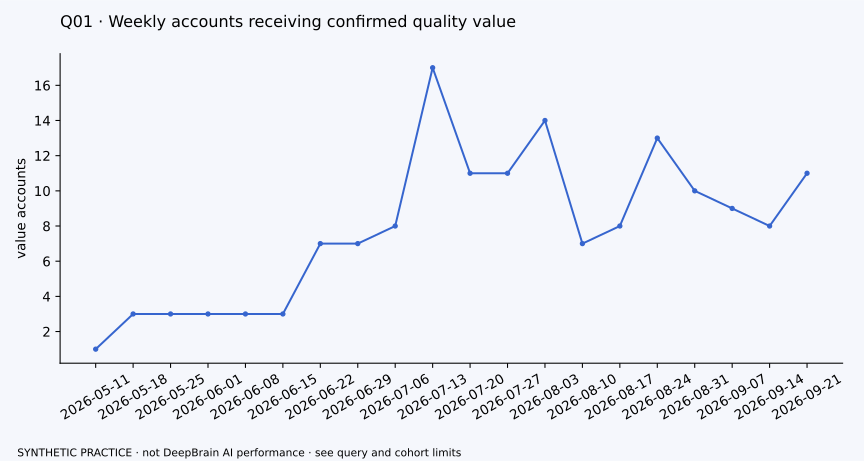
### Q01 · Weekly accounts receiving confirmed quality value
**Decision:** Is confirmed customer value growing across accounts?
**Finding in this fictional example:** The final complete operational week shown, 21 September, has 11 quality-value accounts and 11 confirmed tasks. These are weekly account counts, not paying customers.
**Caveat:** Weeks with no qualifying events are absent from this sparse query; absence is not a plotted zero. Do not sum weekly distinct accounts into unique customers.
**Action / next evidence:** Inspect review coverage and the corresponding task rows before attributing movement to a launch.
**Say, then stop:**
> I would lead with weekly accounts receiving confirmed quality value, then check coverage before explaining a change.
**How it connects:** [DB01](/metrics/#db01-weekly-quality-value-accounts) · [DB02](/metrics/#db02-confirmed-quality-use-tasks) · [Return to Choose the customer outcome](#stop-value)
**Useful companion views:** [Read Q15](#chart-Q15)
**Exact example scope:** Operational: persona/workflow/cohort all; May 1 inclusive to October 1 exclusive 2026 UTC. Rows: 20. Frozen cutoff: 2026-10-23 00:00 UTC. Proposed definitions; synthetic calculation or planning records only.
[Open saved question on this Mac](http://127.0.0.1:3000/question/249?persona=all&workflow=all&cohort=all&from_date=2026-05-01&to_date=2026-10-01) · [Chart/table SVG](/downloads/lab/charts/Q01.svg) · [Full CSV](/downloads/lab/csv/Q01_result.csv) · [Exact SQL](/downloads/lab/sql/Q01.sql)
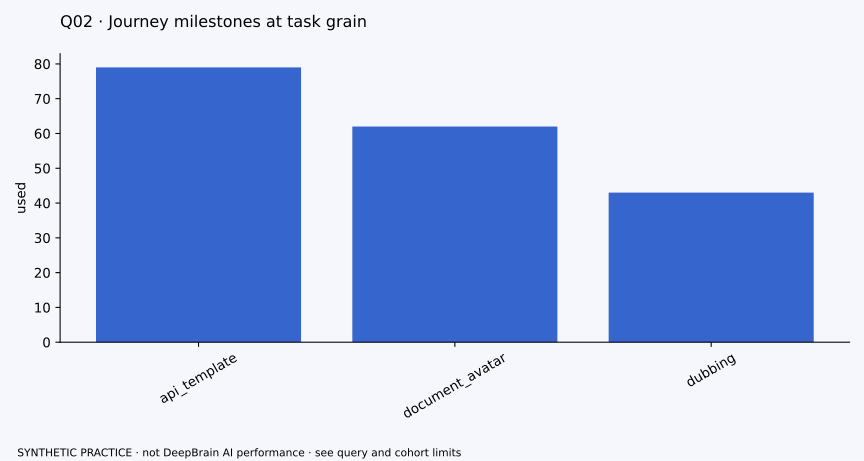
### Q02 · Journey milestones at task grain
**Decision:** Which customer handoff deserves investigation?
**Finding in this fictional example:** Across the default task-created cohort, 877 of 1,081 tasks rendered and 184 met confirmed quality use. Review and export are separate checkpoints.
**Caveat:** Checkpoint columns are overlapping counts, not a compulsory sequential funnel. An eligibility block is not automatically a technical defect.
**Action / next evidence:** Use Q24 or J01 to inspect actual recorded paths, then Q15 for examples.
**Say, then stop:**
> Rendering is one milestone. I would inspect the handoff to approved audience use before adding more creation features.
**How it connects:** [DB03](/metrics/#db03-task-milestone-counts) · [DB04](/metrics/#db04-render-completion-rate) · [Return to Find the limiting handoff](#stop-journey)
**Useful companion views:** [Read Q24](#chart-Q24)
**Exact example scope:** Operational: persona/workflow/cohort all; May 1 inclusive to October 1 exclusive 2026 UTC. Rows: 3. Frozen cutoff: 2026-10-23 00:00 UTC. Proposed definitions; synthetic calculation or planning records only.
[Open saved question on this Mac](http://127.0.0.1:3000/question/250?persona=all&workflow=all&cohort=all&from_date=2026-05-01&to_date=2026-10-01) · [Chart/table SVG](/downloads/lab/charts/Q02.svg) · [Full CSV](/downloads/lab/csv/Q02_result.csv) · [Exact SQL](/downloads/lab/sql/Q02.sql)
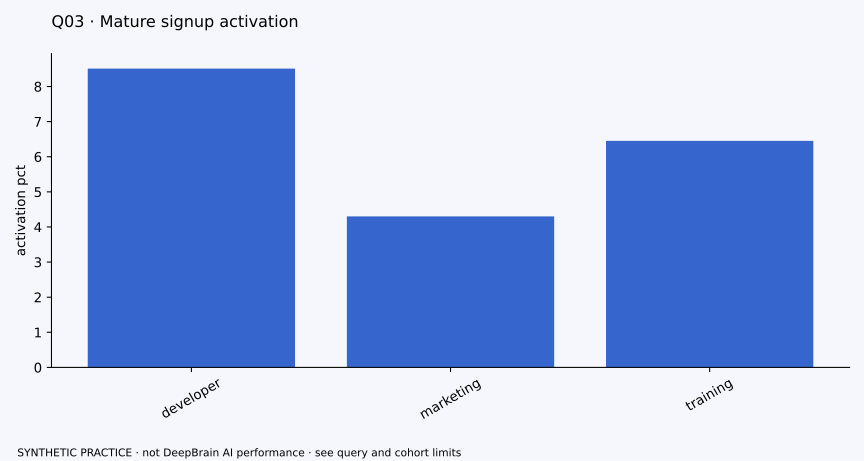
### Q03 · Mature signup activation
**Decision:** Which signup segment needs a closer activation study?
**Finding in this fictional example:** Developer activation is 8 of 94 eligible signups, marketing 4 of 93 and training 6 of 93 in the first seven days.
**Caveat:** Use seven-day mature signups, including zero activity. Counts are small; persona differences do not establish a design effect.
**Action / next evidence:** Inspect zero-task signups and early task records within a comparable persona/workflow.
**Say, then stop:**
> I would keep all eligible signups in the denominator and investigate one segment before proposing an onboarding change.
**How it connects:** [DB05](/metrics/#db05-seven-day-confirmed-value-activation) · [Return to Connect activation to repeat value](#stop-return)
**Useful companion views:** [Read Q05](#chart-Q05)
**Exact example scope:** Operational: persona/workflow/cohort all; May 1 inclusive to October 1 exclusive 2026 UTC. Rows: 3. Frozen cutoff: 2026-10-23 00:00 UTC. Proposed definitions; synthetic calculation or planning records only.
[Open saved question on this Mac](http://127.0.0.1:3000/question/251?persona=all&workflow=all&cohort=all&from_date=2026-05-01&to_date=2026-10-01) · [Chart/table SVG](/downloads/lab/charts/Q03.svg) · [Full CSV](/downloads/lab/csv/Q03_result.csv) · [Exact SQL](/downloads/lab/sql/Q03.sql)
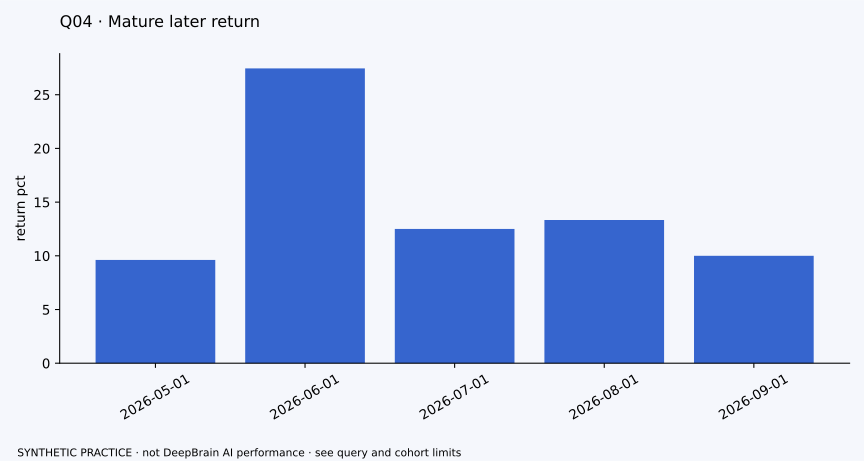
### Q04 · Mature later return
**Decision:** Are comparable signup cohorts returning to quality work?
**Finding in this fictional example:** June has 14 of 51 eligible users returning in days 28–41; May has 5 of 52. The table also supplies later cohorts.
**Caveat:** This is unconditional signup return, not retention among activated users, account renewal or learner retention. September is only the eligible portion of that signup month.
**Action / next evidence:** Check maturity, cohort size, acquisition mix and natural video-production frequency.
**Say, then stop:**
> I would compare mature cohorts and their counts before deciding that retention improved.
**How it connects:** [DB06](/metrics/#db06-days-2841-confirmed-value-return) · [Return to Connect activation to repeat value](#stop-return)
**Useful companion views:** [Read Q05](#chart-Q05)
**Exact example scope:** Operational: persona/workflow/cohort all; May 1 inclusive to October 1 exclusive 2026 UTC. Rows: 5. Frozen cutoff: 2026-10-23 00:00 UTC. Proposed definitions; synthetic calculation or planning records only.
[Open saved question on this Mac](http://127.0.0.1:3000/question/252?persona=all&workflow=all&cohort=all&from_date=2026-05-01&to_date=2026-10-01) · [Chart/table SVG](/downloads/lab/charts/Q04.svg) · [Full CSV](/downloads/lab/csv/Q04_result.csv) · [Exact SQL](/downloads/lab/sql/Q04.sql)
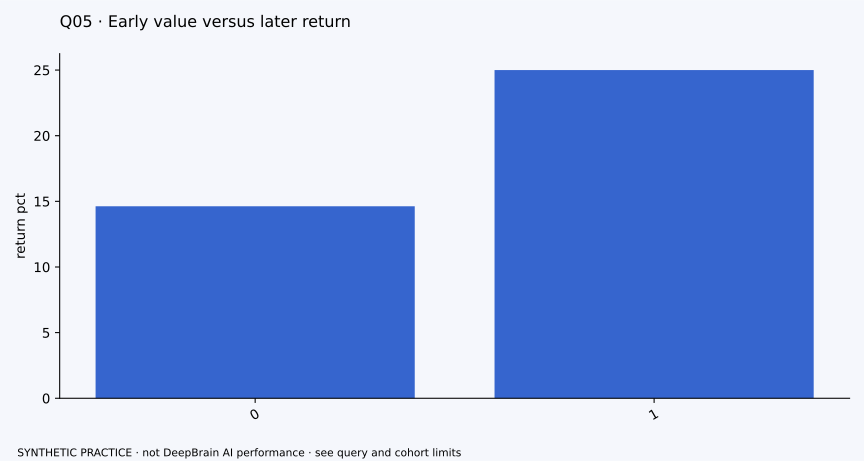
### Q05 · Early value versus later return
**Decision:** Is first-week value a useful signal to investigate?
**Finding in this fictional example:** Three of 12 early-value users later returned, versus 31 of 212 without early value: 25% versus 14.6%.
**Caveat:** This is a descriptive association. Initial intent, persona and shared accounts can explain differences.
**Action / next evidence:** Check G02/G03 within months, then test prediction on a later held-out cohort.
**Say, then stop:**
> Early value is associated with later return here, but I would not call it causal or rely on it before a held-out test.
**How it connects:** [DB05](/metrics/#db05-seven-day-confirmed-value-activation) · [DB06](/metrics/#db06-days-2841-confirmed-value-return) · [Return to Connect activation to repeat value](#stop-return)
**Useful companion views:** [Read Q03](#chart-Q03) · [Read Q04](#chart-Q04)
**Exact example scope:** Operational: persona/workflow/cohort all; May 1 inclusive to October 1 exclusive 2026 UTC. Rows: 2. Frozen cutoff: 2026-10-23 00:00 UTC. Proposed definitions; synthetic calculation or planning records only.
[Open saved question on this Mac](http://127.0.0.1:3000/question/253?persona=all&workflow=all&cohort=all&from_date=2026-05-01&to_date=2026-10-01) · [Chart/table SVG](/downloads/lab/charts/Q05.svg) · [Full CSV](/downloads/lab/csv/Q05_result.csv) · [Exact SQL](/downloads/lab/sql/Q05.sql)
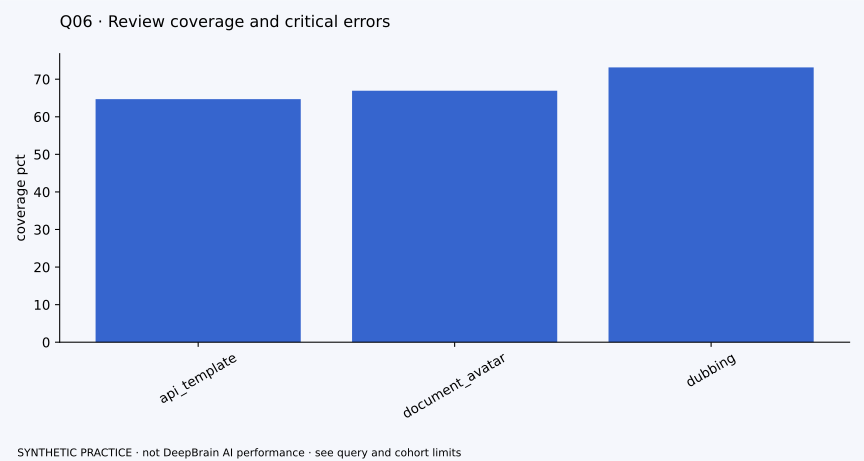
### Q06 · Review coverage and critical errors
**Decision:** How much quality evidence supports the value count?
**Finding in this fictional example:** Preview review coverage ranges from 64.7% to 73.1% across workflows. The retained reviews contain 31 critical-error flags.
**Caveat:** Acceptance applies to reviewed tasks. Missing reviews are unknown, and critical failures must not disappear inside an average acceptance score.
**Action / next evidence:** Inspect error themes and who is missing from the reviewed sample before choosing a quality intervention.
**Say, then stop:**
> I would show review coverage next to acceptance so that missing evidence does not look like either success or rejection.
**How it connects:** [DB07](/metrics/#db07-preview-review-coverage) · [DB08](/metrics/#db08-reviewed-acceptance) · [DB09](/metrics/#db09-critical-content-failures) · [Return to Protect quality and customer effort](#stop-quality)
**Exact example scope:** Operational: persona/workflow/cohort all; May 1 inclusive to October 1 exclusive 2026 UTC. Rows: 3. Frozen cutoff: 2026-10-23 00:00 UTC. Proposed definitions; synthetic calculation or planning records only.
[Open saved question on this Mac](http://127.0.0.1:3000/question/254?persona=all&workflow=all&cohort=all&from_date=2026-05-01&to_date=2026-10-01) · [Chart/table SVG](/downloads/lab/charts/Q06.svg) · [Full CSV](/downloads/lab/csv/Q06_result.csv) · [Exact SQL](/downloads/lab/sql/Q06.sql)
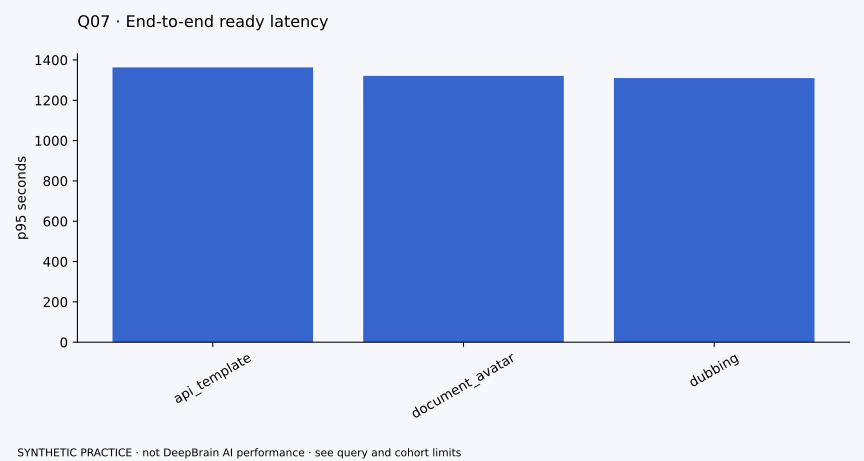
### Q07 · End-to-end ready latency
**Decision:** Should engineering prioritize render latency?
**Finding in this fictional example:** Median ready latency is about 6–7 minutes; workflow p95 values are about 22 minutes in the completed-task sample.
**Caveat:** Creation-to-ready includes the render journey, but excludes later human review. Never add component p95s or average workflow p95s to get an overall p95.
**Action / next evidence:** Compare Q23 before deciding which part of the end-to-end journey to speed up.
**Say, then stop:**
> The render tail matters, but I would compare it with the much longer review-to-use journey before allocating engineering time.
**How it connects:** [DB10](/metrics/#db10-ready-latency-p50p95) · [Return to Find the limiting handoff](#stop-journey)
**Exact example scope:** Operational: persona/workflow/cohort all; May 1 inclusive to October 1 exclusive 2026 UTC. Rows: 3. Frozen cutoff: 2026-10-23 00:00 UTC. Proposed definitions; synthetic calculation or planning records only.
[Open saved question on this Mac](http://127.0.0.1:3000/question/255?persona=all&workflow=all&cohort=all&from_date=2026-05-01&to_date=2026-10-01) · [Chart/table SVG](/downloads/lab/charts/Q07.svg) · [Full CSV](/downloads/lab/csv/Q07_result.csv) · [Exact SQL](/downloads/lab/sql/Q07.sql)
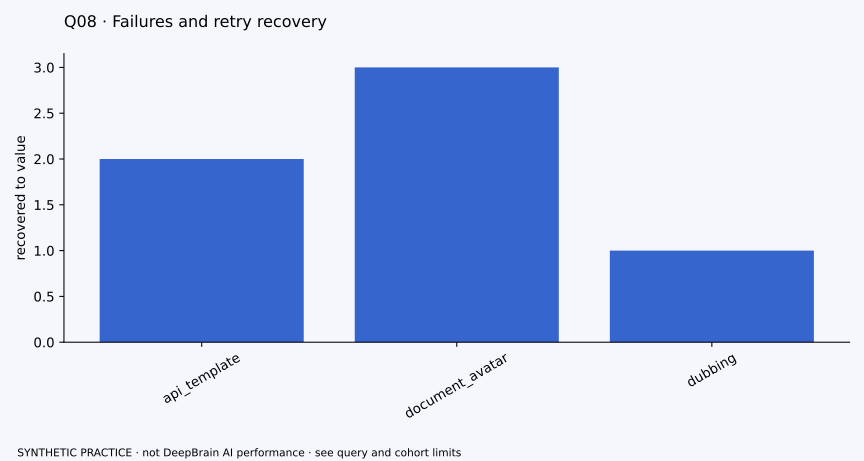
### Q08 · Failures and retry recovery
**Decision:** Does recovery restore useful work, or only technical completion?
**Finding in this fictional example:** Of 155 tasks with a failed attempt, 29 later rendered and six reached confirmed quality use by cutoff.
**Caveat:** Right censoring and missing confirmation limit recovery-to-value counts. A helpful retry is not a defect just because retry rate rises.
**Action / next evidence:** Inspect recoverable failure classes, recent-task observation time and entitlement reconciliation.
**Say, then stop:**
> I would judge recovery by restored customer value, while checking whether recent tasks had enough time to recover.
**How it connects:** [DB11](/metrics/#db11-failure-recovery-to-value) · [DB12](/metrics/#db12-task-retry-rate) · [Return to Find the limiting handoff](#stop-journey)
**Exact example scope:** Operational: persona/workflow/cohort all; May 1 inclusive to October 1 exclusive 2026 UTC. Rows: 3. Frozen cutoff: 2026-10-23 00:00 UTC. Proposed definitions; synthetic calculation or planning records only.
[Open saved question on this Mac](http://127.0.0.1:3000/question/256?persona=all&workflow=all&cohort=all&from_date=2026-05-01&to_date=2026-10-01) · [Chart/table SVG](/downloads/lab/charts/Q08.svg) · [Full CSV](/downloads/lab/csv/Q08_result.csv) · [Exact SQL](/downloads/lab/sql/Q08.sql)
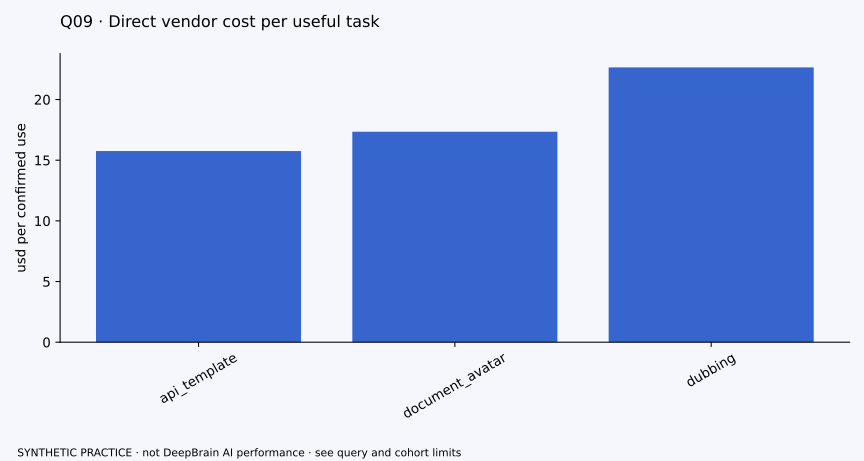
### Q09 · Direct vendor cost per useful task
**Decision:** Which workflow consumes more direct cost per confirmed outcome?
**Finding in this fictional example:** Direct vendor cost per confirmed-use task is about $15.75 for API templates, $17.34 for document avatars and $22.65 for dubbing.
**Caveat:** All task costs, including unsuccessful work, are included. These are illustrative vendor allocations, not total company cost or actual AI Studios margins.
**Action / next evidence:** Use Q11 to inspect the numerator and Q06 to understand confirmation coverage before changing price.
**Say, then stop:**
> Dubbing looks more expensive per confirmed outcome in this sample, so I would inspect workload and coverage before recommending pricing.
**How it connects:** [DB13](/metrics/#db13-direct-vendor-usd-per-confirmed-use-task) · [Return to Connect value to sustainable economics](#stop-economics)
**Useful companion views:** [Read Q11](#chart-Q11)
**Exact example scope:** Operational: persona/workflow/cohort all; May 1 inclusive to October 1 exclusive 2026 UTC. Rows: 3. Frozen cutoff: 2026-10-23 00:00 UTC. Proposed definitions; synthetic calculation or planning records only.
[Open saved question on this Mac](http://127.0.0.1:3000/question/257?persona=all&workflow=all&cohort=all&from_date=2026-05-01&to_date=2026-10-01) · [Chart/table SVG](/downloads/lab/charts/Q09.svg) · [Full CSV](/downloads/lab/csv/Q09_result.csv) · [Exact SQL](/downloads/lab/sql/Q09.sql)
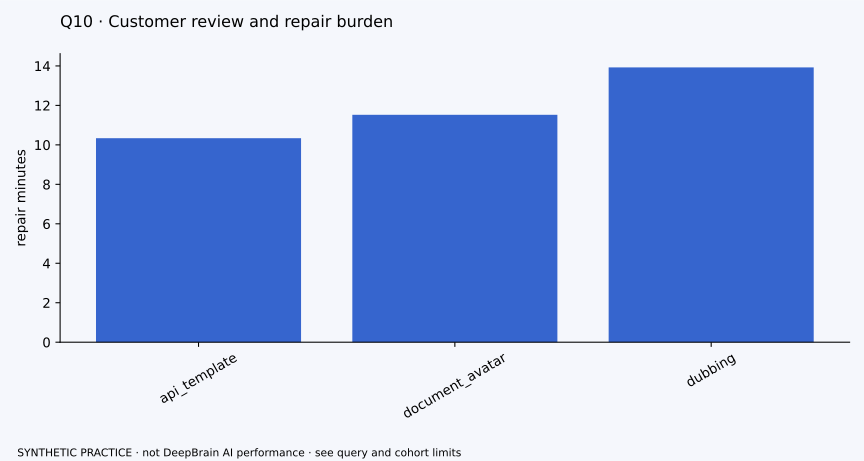
### Q10 · Customer review and repair burden
**Decision:** Is automation reducing customer effort?
**Finding in this fictional example:** Reviewed tasks still average roughly 31–35 active minutes across preparation, review and repair, depending on workflow.
**Caveat:** The manual alternative is an estimate; estimated net minutes are not measured causal time savings. Customer labor is separate from vendor expense.
**Action / next evidence:** Observe the review workflow and test changes against measured active effort and critical errors.
**Say, then stop:**
> I would measure the work customers still do after generation, rather than assume faster rendering means equivalent time saved.
**How it connects:** [DB14](/metrics/#db14-customer-active-review-and-repair) · [DB15](/metrics/#db15-estimated-net-customer-time) · [Return to Protect quality and customer effort](#stop-quality)
**Exact example scope:** Operational: persona/workflow/cohort all; May 1 inclusive to October 1 exclusive 2026 UTC. Rows: 3. Frozen cutoff: 2026-10-23 00:00 UTC. Proposed definitions; synthetic calculation or planning records only.
[Open saved question on this Mac](http://127.0.0.1:3000/question/258?persona=all&workflow=all&cohort=all&from_date=2026-05-01&to_date=2026-10-01) · [Chart/table SVG](/downloads/lab/charts/Q10.svg) · [Full CSV](/downloads/lab/csv/Q10_result.csv) · [Exact SQL](/downloads/lab/sql/Q10.sql)
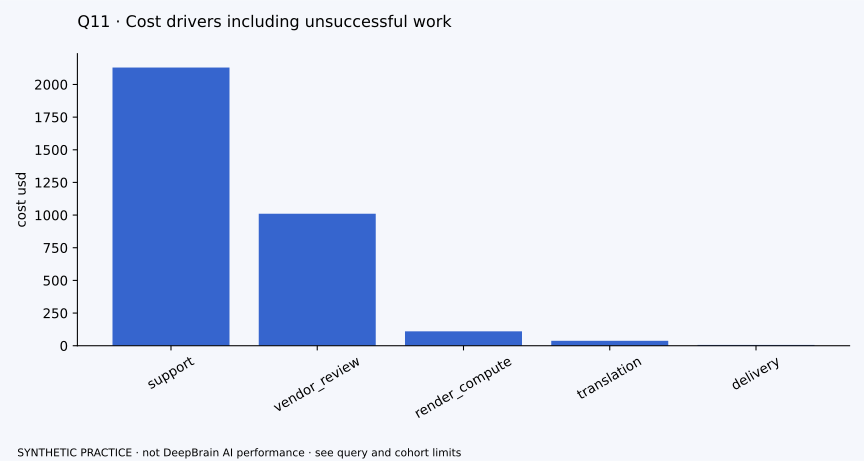
### Q11 · Cost drivers including unsuccessful work
**Decision:** What is driving the cost numerator?
**Finding in this fictional example:** Support contributes about $2,129 and vendor review $1,010, compared with $110 of render compute in the default task cohort.
**Caveat:** Rates are fictional. Units differ by row; compare USD costs, not a sum of staff minutes, compute seconds and GB.
**Action / next evidence:** Investigate repeated support/review causes before treating compute optimization as the largest savings opportunity.
**Say, then stop:**
> In this practice model, human operations dominate direct cost. I would investigate those causes before optimizing the smallest compute line.
**How it connects:** [DB13](/metrics/#db13-direct-vendor-usd-per-confirmed-use-task) · [Return to Connect value to sustainable economics](#stop-economics)
**Useful companion views:** [Read Q09](#chart-Q09)
**Exact example scope:** Operational: persona/workflow/cohort all; May 1 inclusive to October 1 exclusive 2026 UTC. Rows: 5. Frozen cutoff: 2026-10-23 00:00 UTC. Proposed definitions; synthetic calculation or planning records only.
[Open saved question on this Mac](http://127.0.0.1:3000/question/259?persona=all&workflow=all&cohort=all&from_date=2026-05-01&to_date=2026-10-01) · [Chart/table SVG](/downloads/lab/charts/Q11.svg) · [Full CSV](/downloads/lab/csv/Q11_result.csv) · [Exact SQL](/downloads/lab/sql/Q11.sql)
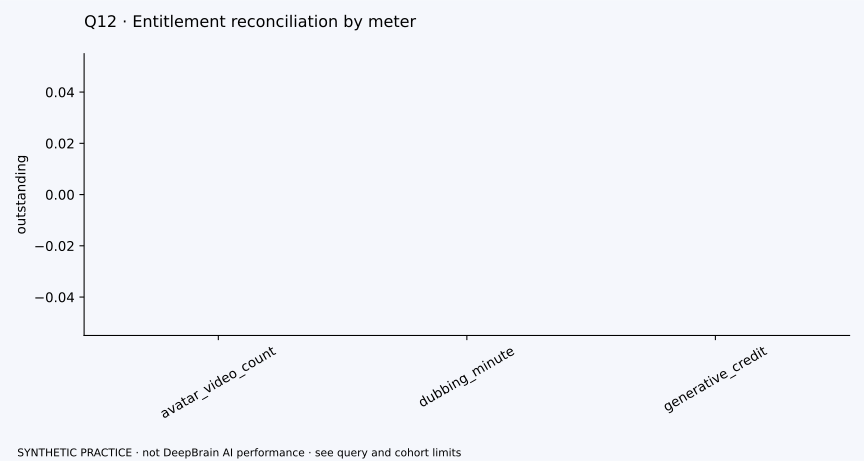
### Q12 · Entitlement reconciliation by meter
**Decision:** Are resource reservations reconciled correctly?
**Finding in this fictional example:** Each of the three meters has zero outstanding balance: reserved minus consumed minus released equals zero.
**Caveat:** A balanced simplified ledger does not validate payment, refunds or a real production billing system. Video counts, minutes and credits are incompatible units.
**Action / next evidence:** Trace failed-task examples and duplicate requests before concluding that billing is trustworthy.
**Say, then stop:**
> I would reconcile each meter separately and test failure recovery; a zero balance is useful evidence, not proof of complete billing correctness.
**How it connects:** [DB16](/metrics/#db16-entitlement-outstanding) · [Return to Connect value to sustainable economics](#stop-economics)
**Exact example scope:** Operational: persona/workflow/cohort all; May 1 inclusive to October 1 exclusive 2026 UTC. Rows: 3. Frozen cutoff: 2026-10-23 00:00 UTC. Proposed definitions; synthetic calculation or planning records only.
[Open saved question on this Mac](http://127.0.0.1:3000/question/260?persona=all&workflow=all&cohort=all&from_date=2026-05-01&to_date=2026-10-01) · [Chart/table SVG](/downloads/lab/charts/Q12.svg) · [Full CSV](/downloads/lab/csv/Q12_result.csv) · [Exact SQL](/downloads/lab/sql/Q12.sql)
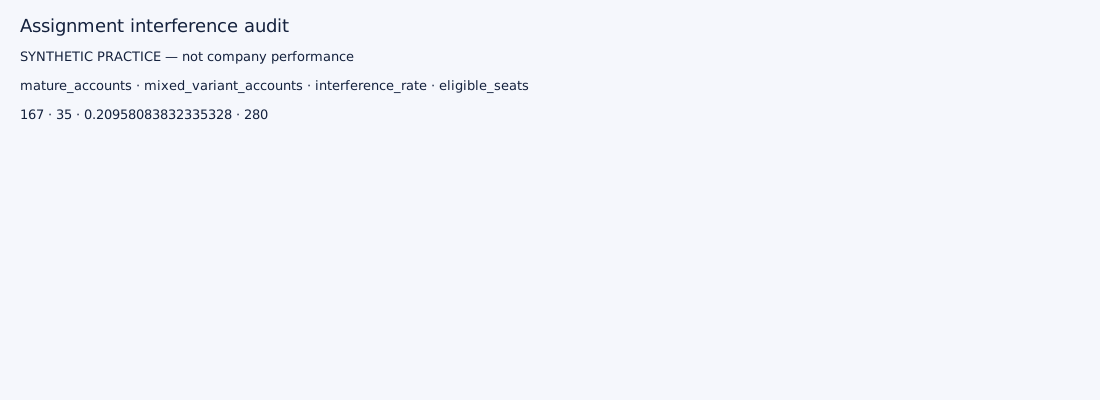
### Q13 · Assignment interference audit
**Decision:** Can this assignment support an account-level experiment claim?
**Finding in this fictional example:** Thirty-five of 167 mature accounts have users in more than one variant, about 21%.
**Caveat:** This is an interference audit, not a treatment-effect estimate. User-level assignment does not make team accounts independent.
**Action / next evidence:** Randomize at the account/team level if users collaborate, and predefine the outcome and maturity window.
**Say, then stop:**
> I would fix the unit of assignment before interpreting a team-workflow experiment, because mixed treatment within accounts can contaminate results.
**How it connects:** [DB17](/metrics/#db17-experiment-assignment-validity) · [Return to Challenge the apparent success story](#stop-evidence)
**Exact example scope:** Operational: persona/workflow/cohort all; May 1 inclusive to October 1 exclusive 2026 UTC. Rows: 1. Frozen cutoff: 2026-10-23 00:00 UTC. Proposed definitions; synthetic calculation or planning records only.
[Open saved question on this Mac](http://127.0.0.1:3000/question/261?persona=all&workflow=all&cohort=all&from_date=2026-05-01&to_date=2026-10-01) · [Chart/table SVG](/downloads/lab/charts/Q13.svg) · [Full CSV](/downloads/lab/csv/Q13_result.csv) · [Exact SQL](/downloads/lab/sql/Q13.sql)
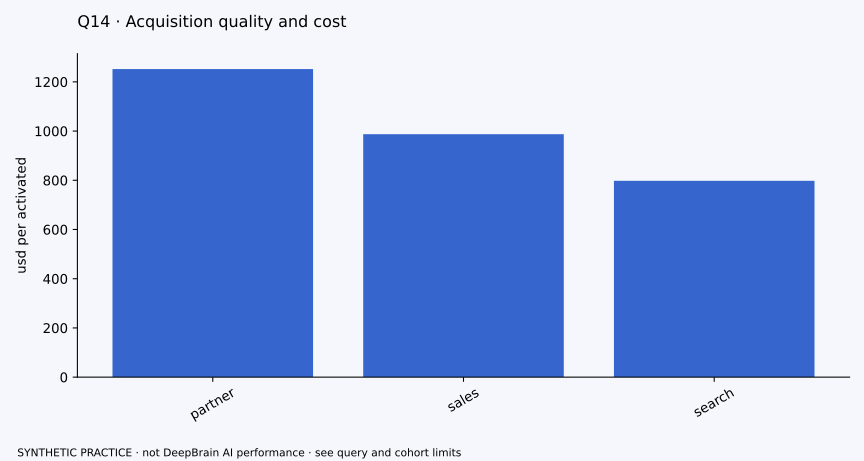
### Q14 · Acquisition quality and cost
**Decision:** Which acquisition channel deserves a controlled next test?
**Finding in this fictional example:** Allocated spend per activated mature user ranges from about $798 for search to $1,252 for partners; the activated counts are only 3–5 per channel.
**Caveat:** This is allocated fictional spend per activated user, not paid-customer CAC or lifetime-value payback. Activation and later-return populations must stay eligible.
**Action / next evidence:** Examine quality return, account value and confidence before a small incremental channel test.
**Say, then stop:**
> I would not move the budget on three to five activations per channel. I would validate downstream value with another mature cohort.
**How it connects:** [DB18](/metrics/#db18-acquisition-spend-per-activated-mature-user) · [Return to Connect value to sustainable economics](#stop-economics)
**Exact example scope:** Operational: persona/workflow/cohort all; May 1 inclusive to October 1 exclusive 2026 UTC. Rows: 3. Frozen cutoff: 2026-10-23 00:00 UTC. Proposed definitions; synthetic calculation or planning records only.
[Open saved question on this Mac](http://127.0.0.1:3000/question/262?persona=all&workflow=all&cohort=all&from_date=2026-05-01&to_date=2026-10-01) · [Chart/table SVG](/downloads/lab/charts/Q14.svg) · [Full CSV](/downloads/lab/csv/Q14_result.csv) · [Exact SQL](/downloads/lab/sql/Q14.sql)
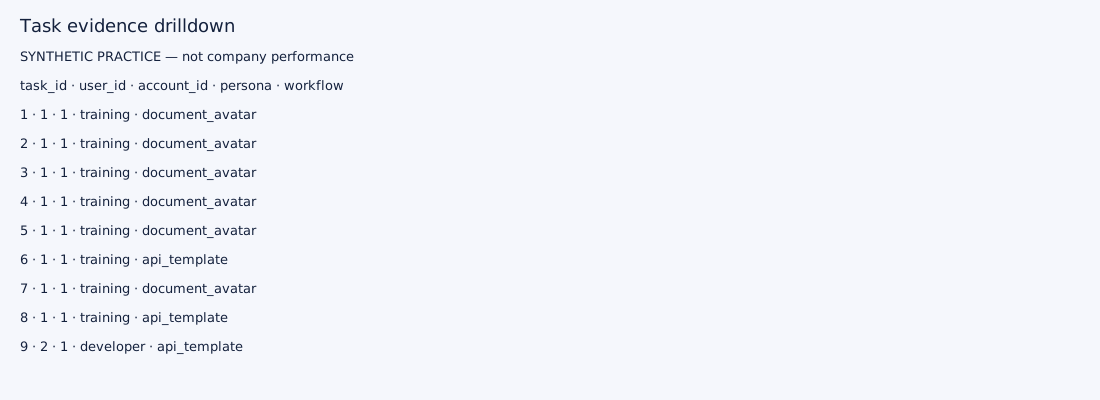
### Q15 · Task evidence drilldown
**Decision:** What happened in an individual task behind the chart?
**Finding in this fictional example:** Task 1 rendered but has no recorded review or use. Task 3 has acceptance, confirmed use and confirmed_quality_use equal to one.
**Caveat:** A task row is evidence about one fictional record, not prevalence. Costs are already preaggregated before the task join.
**Action / next evidence:** Use contrasting task examples to diagnose the missing handoff, then validate the pattern in the eligible population.
**Say, then stop:**
> I would inspect one successful and one unresolved task to explain the mechanism, then return to the full denominator.
**How it connects:** [DB01](/metrics/#db01-weekly-quality-value-accounts) · [Return to Make one bounded product decision](#stop-decision)
**Useful companion views:** [Read Q01](#chart-Q01)
**Exact example scope:** Operational: persona/workflow/cohort all; May 1 inclusive to October 1 exclusive 2026 UTC. Rows: 1081. Frozen cutoff: 2026-10-23 00:00 UTC. Proposed definitions; synthetic calculation or planning records only.
[Open saved question on this Mac](http://127.0.0.1:3000/question/263?persona=all&workflow=all&cohort=all&from_date=2026-05-01&to_date=2026-10-01) · [Chart/table SVG](/downloads/lab/charts/Q15.svg) · [Full CSV](/downloads/lab/csv/Q15_result.csv) · [Exact SQL](/downloads/lab/sql/Q15.sql)
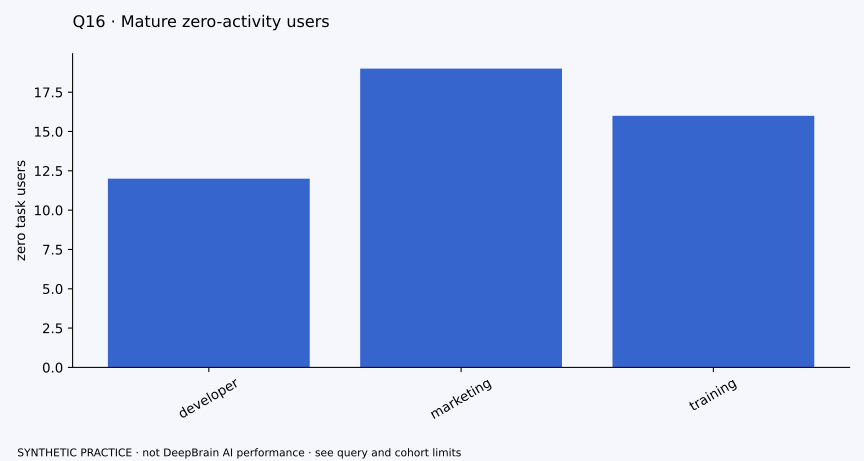
### Q16 · Mature zero-activity users
**Decision:** Are inactive signups hidden by an event-only denominator?
**Finding in this fictional example:** Forty-seven of 224 mature users have no recorded task: 12 developers, 19 marketers and 16 training users.
**Caveat:** No task is not automatically churn or dissatisfaction. Query from eligible users with a left join, rather than only observed task events.
**Action / next evidence:** Separate missing intent, access/setup obstacles and expected low-frequency use through customer research.
**Say, then stop:**
> I would keep zero-activity users visible and learn why they did not start before deciding that an onboarding prompt is the answer.
**How it connects:** [DB19](/metrics/#db19-mature-zero-task-share) · [Return to Connect activation to repeat value](#stop-return)
**Exact example scope:** Operational: persona/workflow/cohort all; May 1 inclusive to October 1 exclusive 2026 UTC. Rows: 3. Frozen cutoff: 2026-10-23 00:00 UTC. Proposed definitions; synthetic calculation or planning records only.
[Open saved question on this Mac](http://127.0.0.1:3000/question/264?persona=all&workflow=all&cohort=all&from_date=2026-05-01&to_date=2026-10-01) · [Chart/table SVG](/downloads/lab/charts/Q16.svg) · [Full CSV](/downloads/lab/csv/Q16_result.csv) · [Exact SQL](/downloads/lab/sql/Q16.sql)
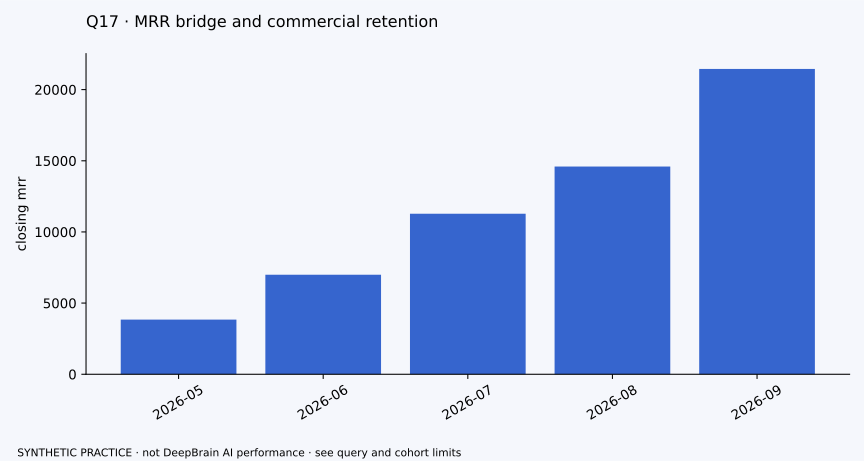
### Q17 · MRR bridge and commercial retention
**Decision:** Is subscription growth being sustained by existing customers?
**Finding in this fictional example:** September closing MRR is $21,453.96 while NRR is about 95.9%; new MRR of $7,455 outweighs losses from the opening base.
**Caveat:** MRR is a monthly stock, not cash. Do not sum closing MRR across months; NRR above 100% is a ratio, not a percentage-point gain.
**Action / next evidence:** Separate new acquisition from contraction/churn and investigate existing-account value.
**Say, then stop:**
> I would separate new sales from existing-customer retention: growing total MRR can conceal a shrinking opening customer base.
**How it connects:** [DB20](/metrics/#db20-closing-subscription-mrr) · [DB21](/metrics/#db21-gross-revenue-retention) · [DB22](/metrics/#db22-net-revenue-retention) · [Return to Connect value to sustainable economics](#stop-economics)
**Exact example scope:** Operational: persona/workflow/cohort all; May 1 inclusive to October 1 exclusive 2026 UTC. Rows: 5. Frozen cutoff: 2026-10-23 00:00 UTC. Proposed definitions; synthetic calculation or planning records only.
[Open saved question on this Mac](http://127.0.0.1:3000/question/265?persona=all&workflow=all&cohort=all&from_date=2026-05-01&to_date=2026-10-01) · [Chart/table SVG](/downloads/lab/charts/Q17.svg) · [Full CSV](/downloads/lab/csv/Q17_result.csv) · [Exact SQL](/downloads/lab/sql/Q17.sql)
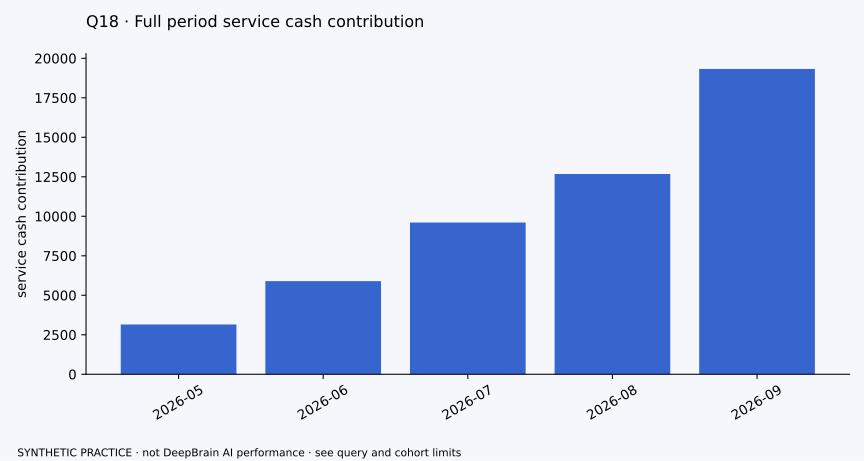
### Q18 · Full period service cash contribution
**Decision:** Does revenue cover the modeled full service burden?
**Finding in this fictional example:** September service cash contribution is about $19,329; after the modeled R&D allocation the cash proxy is about $18,004.
**Caveat:** This modeled cash contribution is not accounting profit, audited margin or all company overhead. It has a different grain from per-task costs.
**Action / next evidence:** Reconcile net cash, fees, task costs and shared costs before assessing a proposed investment.
**Say, then stop:**
> I would evaluate economics with a period bridge, keeping cash, recurring revenue and allocated costs separate.
**How it connects:** [DB23](/metrics/#db23-full-period-service-cash-contribution) · [Return to Connect value to sustainable economics](#stop-economics)
**Exact example scope:** Operational: persona/workflow/cohort all; May 1 inclusive to October 1 exclusive 2026 UTC. Rows: 5. Frozen cutoff: 2026-10-23 00:00 UTC. Proposed definitions; synthetic calculation or planning records only.
[Open saved question on this Mac](http://127.0.0.1:3000/question/266?persona=all&workflow=all&cohort=all&from_date=2026-05-01&to_date=2026-10-01) · [Chart/table SVG](/downloads/lab/charts/Q18.svg) · [Full CSV](/downloads/lab/csv/Q18_result.csv) · [Exact SQL](/downloads/lab/sql/Q18.sql)
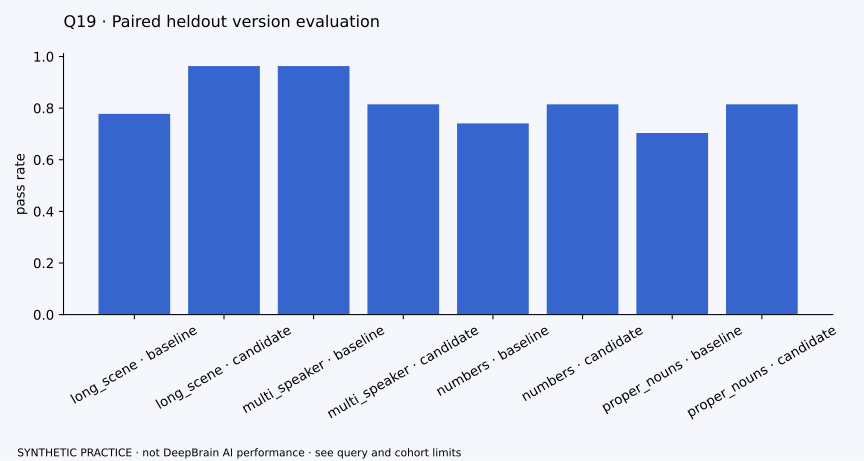
### Q19 · Paired heldout version evaluation
**Decision:** Can the proposed model/version be released safely?
**Finding in this fictional example:** In the paired multi-speaker slice, passes fall from 26/27 to 22/27 and critical errors rise from zero to one, despite gains in other slices.
**Caveat:** Cases are held out and paired, but synthetic. Slice averages alone are not paired significance tests or representative production guarantees.
**Action / next evidence:** Investigate the regressing slice and critical cases; define an explicit safety gate before any limited rollout.
**Say, then stop:**
> I would hold broad rollout: aggregate gains do not outweigh an unresolved multi-speaker regression and critical-error evidence.
**How it connects:** [DB24](/metrics/#db24-heldout-task-pass-by-slice) · [Return to Protect quality and customer effort](#stop-quality)
**Exact example scope:** Operational: persona/workflow/cohort all; May 1 inclusive to October 1 exclusive 2026 UTC. Rows: 8. Frozen cutoff: 2026-10-23 00:00 UTC. Proposed definitions; synthetic calculation or planning records only.
[Open saved question on this Mac](http://127.0.0.1:3000/question/267?persona=all&workflow=all&cohort=all&from_date=2026-05-01&to_date=2026-10-01) · [Chart/table SVG](/downloads/lab/charts/Q19.svg) · [Full CSV](/downloads/lab/csv/Q19_result.csv) · [Exact SQL](/downloads/lab/sql/Q19.sql)
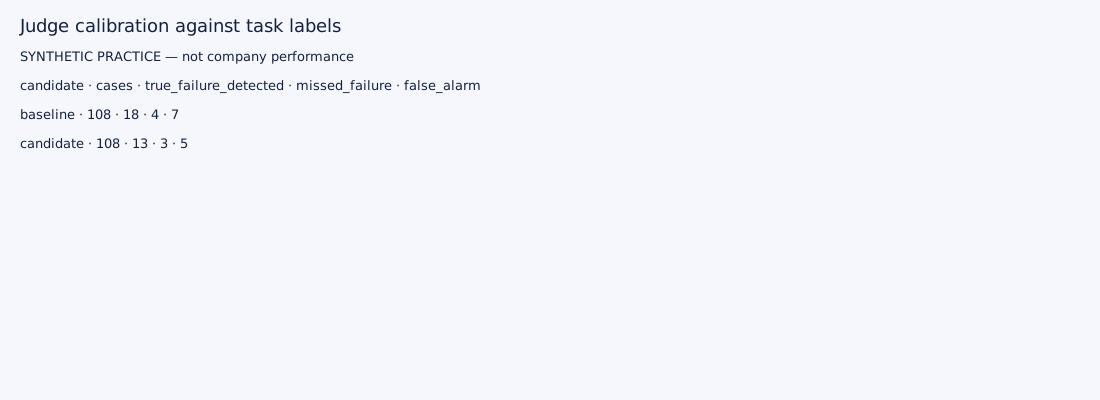
### Q20 · Judge calibration against task labels
**Decision:** Can an automated judge safely replace independent review?
**Finding in this fictional example:** The candidate judge misses three of 16 expert-labeled failures; the baseline judge misses four of 22.
**Caveat:** Failure recall is detected failures divided by all actual failures, not accuracy over all cases. Averages can hide severe false passes.
**Action / next evidence:** Inspect false passes and keep independent review of high-risk cases before changing review coverage.
**Say, then stop:**
> I would evaluate the failures the judge misses, not just its overall accuracy, before reducing human review.
**How it connects:** [DB25](/metrics/#db25-judge-failure-detection-recall) · [Return to Protect quality and customer effort](#stop-quality)
**Exact example scope:** Operational: persona/workflow/cohort all; May 1 inclusive to October 1 exclusive 2026 UTC. Rows: 2. Frozen cutoff: 2026-10-23 00:00 UTC. Proposed definitions; synthetic calculation or planning records only.
[Open saved question on this Mac](http://127.0.0.1:3000/question/268?persona=all&workflow=all&cohort=all&from_date=2026-05-01&to_date=2026-10-01) · [Chart/table SVG](/downloads/lab/charts/Q20.svg) · [Full CSV](/downloads/lab/csv/Q20_result.csv) · [Exact SQL](/downloads/lab/sql/Q20.sql)
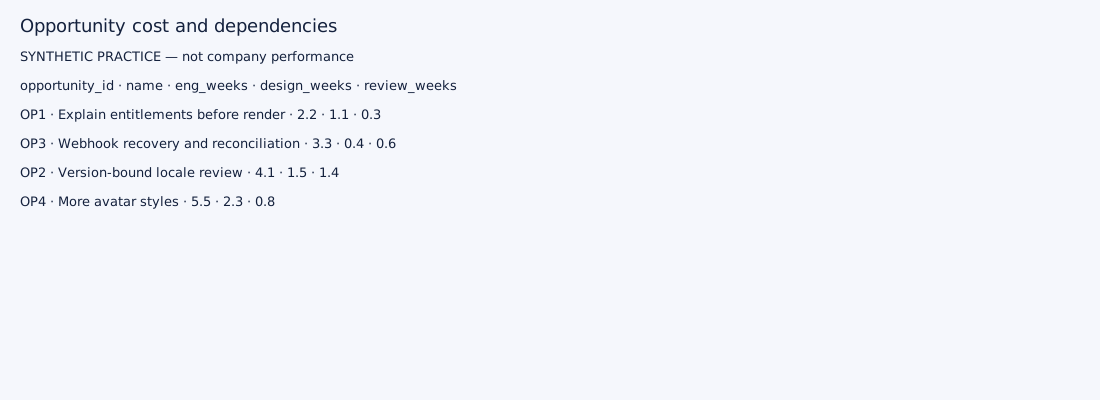
### Q21 · Opportunity cost and dependencies
**Decision:** Which bounded opportunity is worth the next evidence step?
**Finding in this fictional example:** Proposed engineering estimates range from 2.2 to 5.5 weeks. Version-bound locale review depends on entitlement clarity.
**Caveat:** Effort and reach ranges are planning assumptions, not delivery commitments or measured demand. Do not add incompatible role-weeks into a single staffing promise.
**Action / next evidence:** Validate the customer problem and dependency, then fund a bounded test with a named owner.
**Say, then stop:**
> I would choose the smallest justified bet with its dependency and evidence gate, rather than rank ideas by the largest optimistic reach.
**How it connects:** [DB26](/metrics/#db26-engineering-capacity-demand) · [Return to Make one bounded product decision](#stop-decision)
**Exact example scope:** Operational: persona/workflow/cohort all; May 1 inclusive to October 1 exclusive 2026 UTC. Rows: 4. Frozen cutoff: 2026-10-23 00:00 UTC. Proposed definitions; synthetic calculation or planning records only.
[Open saved question on this Mac](http://127.0.0.1:3000/question/269?persona=all&workflow=all&cohort=all&from_date=2026-05-01&to_date=2026-10-01) · [Chart/table SVG](/downloads/lab/charts/Q21.svg) · [Full CSV](/downloads/lab/csv/Q21_result.csv) · [Exact SQL](/downloads/lab/sql/Q21.sql)
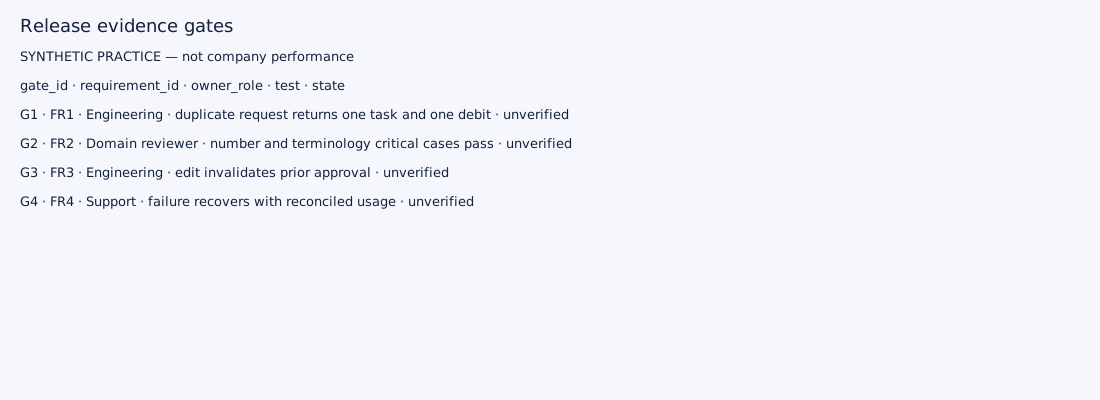
### Q22 · Release evidence gates
**Decision:** What evidence is required before release?
**Finding in this fictional example:** All four proposed gates are unverified: duplicate-request behavior, critical terminology cases, stale approval invalidation and reconciled recovery.
**Caveat:** These are proposed readiness requirements, not failures observed inside DeepBrain. Unknown is not verified.
**Action / next evidence:** Assign the engineering/domain/support owners and gather test evidence for each gate.
**Say, then stop:**
> I would make the release decision conditional on the named tests, not treat a completed feature ticket as evidence that it is safe to ship.
**How it connects:** [DB27](/metrics/#db27-unresolved-release-gates) · [Return to Make one bounded product decision](#stop-decision)
**Exact example scope:** Operational: persona/workflow/cohort all; May 1 inclusive to October 1 exclusive 2026 UTC. Rows: 4. Frozen cutoff: 2026-10-23 00:00 UTC. Proposed definitions; synthetic calculation or planning records only.
[Open saved question on this Mac](http://127.0.0.1:3000/question/270?persona=all&workflow=all&cohort=all&from_date=2026-05-01&to_date=2026-10-01) · [Chart/table SVG](/downloads/lab/charts/Q22.svg) · [Full CSV](/downloads/lab/csv/Q22_result.csv) · [Exact SQL](/downloads/lab/sql/Q22.sql)
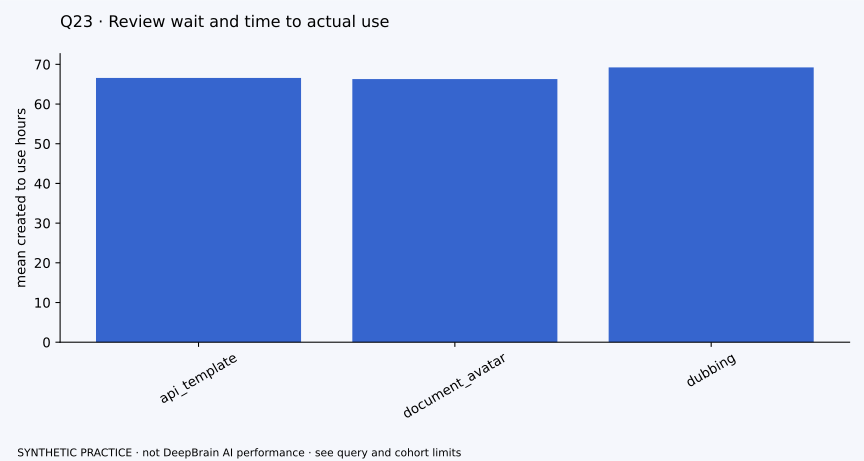
### Q23 · Review wait and time to actual use
**Decision:** Is the main time bottleneck technical or organizational?
**Finding in this fictional example:** Mean ready-to-review waits are about 30–32 hours and creation-to-confirmed-use means about 66–69 hours, far longer than median render minutes.
**Caveat:** The review and use means use different selected subsets. They cannot be added into a stage-by-stage latency decomposition.
**Action / next evidence:** Study review queues, ownership and version handoffs while protecting quality; test against actual use time.
**Say, then stop:**
> I would investigate the review handoff before assuming faster rendering is the highest-value latency improvement.
**How it connects:** [DB28](/metrics/#db28-time-from-creation-to-confirmed-use) · [Return to Find the limiting handoff](#stop-journey)
**Exact example scope:** Operational: persona/workflow/cohort all; May 1 inclusive to October 1 exclusive 2026 UTC. Rows: 3. Frozen cutoff: 2026-10-23 00:00 UTC. Proposed definitions; synthetic calculation or planning records only.
[Open saved question on this Mac](http://127.0.0.1:3000/question/271?persona=all&workflow=all&cohort=all&from_date=2026-05-01&to_date=2026-10-01) · [Chart/table SVG](/downloads/lab/charts/Q23.svg) · [Full CSV](/downloads/lab/csv/Q23_result.csv) · [Exact SQL](/downloads/lab/sql/Q23.sql)
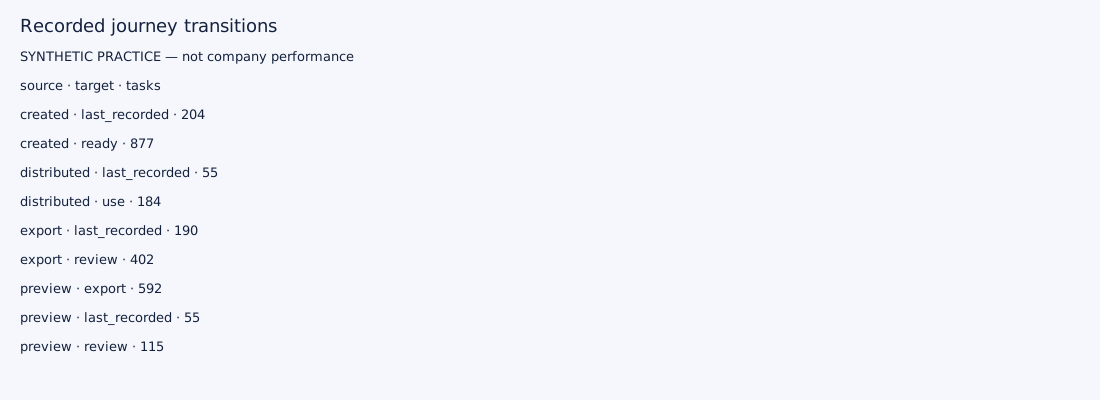
### Q24 · Recorded journey transitions
**Decision:** Where does the recorded task journey actually stop?
**Finding in this fictional example:** The default cohort has 877 recorded created-to-ready transitions and 204 created-to-last-recorded endpoints.
**Caveat:** Last recorded is not proof of abandonment. Export and review may be parallel; these are task transitions, not unique users.
**Action / next evidence:** Inspect skipped checkpoints, endpoint records and review coverage before proposing a recovery change.
**Say, then stop:**
> I would use the recorded path to choose an investigation, then check whether missing telemetry explains the apparent drop-off.
**How it connects:** [DB03](/metrics/#db03-task-milestone-counts) · [Return to Find the limiting handoff](#stop-journey)
**Useful companion views:** [Read Q02](#chart-Q02)
**Exact example scope:** Operational: persona/workflow/cohort all; May 1 inclusive to October 1 exclusive 2026 UTC. Rows: 14. Frozen cutoff: 2026-10-23 00:00 UTC. Proposed definitions; synthetic calculation or planning records only.
[Open saved question on this Mac](http://127.0.0.1:3000/question/272?persona=all&workflow=all&cohort=all&from_date=2026-05-01&to_date=2026-10-01) · [Chart/table SVG](/downloads/lab/charts/Q24.svg) · [Full CSV](/downloads/lab/csv/Q24_result.csv) · [Exact SQL](/downloads/lab/sql/Q24.sql)
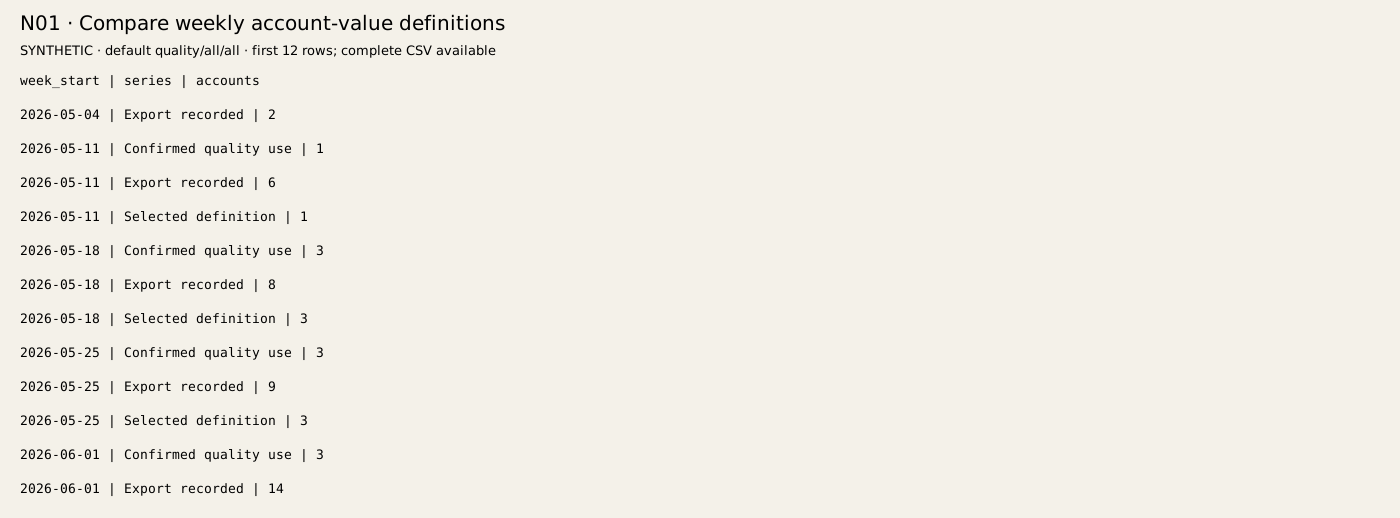
### N01 · Compare weekly account-value definitions
**Decision:** What changes when we choose a weaker value definition?
**Finding in this fictional example:** In the complete week of 12 October, 28 accounts exported while 14 accounts had confirmed quality use.
**Caveat:** This explorer uses the full frozen snapshot, unlike the operational May–September default. Each definition anchors on its own event time.
**Action / next evidence:** Keep exports as a diagnostic and inspect quality-confirmation coverage before judging the gap.
**Say, then stop:**
> I would distinguish distribution volume from confirmed audience value; a larger export count does not make it the better North Star.
**How it connects:** [DB01](/metrics/#db01-weekly-quality-value-accounts) · [DB02](/metrics/#db02-confirmed-quality-use-tasks) · [Return to Choose the customer outcome](#stop-value)
**Useful companion views:** [Read Q01](#chart-Q01) · [Read Q15](#chart-Q15)
**Exact example scope:** Explorer: quality definition; persona/workflow all; full frozen snapshot. Rows: 70. Frozen cutoff: 2026-10-23 00:00 UTC. Proposed definitions; synthetic calculation or planning records only.
[Open saved question on this Mac](http://127.0.0.1:3000/question/341?definition=quality&persona=all&workflow=all) · [Chart/table SVG](/downloads/lab/relationship/N01.svg) · [Full CSV](/downloads/lab/relationship/N01.csv) · [Exact SQL](/downloads/metabase/relationship_lab/N01.sql)
### N02 · Task drivers and review coverage
**Decision:** Which measured handoff could explain the value gap?
**Finding in this fictional example:** In the full snapshot, 80.2% of tasks rendered and 17% reached confirmed quality use; 68.3% of previews have reviews.
**Caveat:** These fractions have different denominators. They are candidate drivers, not multipliers that reproduce distinct-account value.
**Action / next evidence:** Inspect completion, review coverage and post-render workflow together.
**Say, then stop:**
> The task-level gap tells me where to investigate; it does not by itself tell me which intervention will cause account value to rise.
**How it connects:** [DB04](/metrics/#db04-render-completion-rate) · [DB07](/metrics/#db07-preview-review-coverage) · [Return to Choose the customer outcome](#stop-value)
**Useful companion views:** [Read Q02](#chart-Q02) · [Read Q06](#chart-Q06)
**Exact example scope:** Explorer: quality definition; persona/workflow all; full frozen snapshot. Rows: 4. Frozen cutoff: 2026-10-23 00:00 UTC. Proposed definitions; synthetic calculation or planning records only.
[Open saved question on this Mac](http://127.0.0.1:3000/question/342?definition=quality&persona=all&workflow=all) · [Chart/table SVG](/downloads/lab/relationship/N02.svg) · [Full CSV](/downloads/lab/relationship/N02.csv) · [Exact SQL](/downloads/metabase/relationship_lab/N02.sql)

### N03 · Explain metric relationships and guardrails
**Decision:** Which links are mathematical, observed or still hypothetical?
**Finding in this fictional example:** The relationship table labels a fixed-population identity, a synthetic association and proposed causal links separately.
**Caveat:** No arrow has an estimated causal weight. Account-week arithmetic only works for exactly the same eligible account-week population.
**Action / next evidence:** State the type of link before defending a metric tree.
**Say, then stop:**
> I would make the metric relationships explicit and distinguish arithmetic from evidence about what causes customer behavior.
**How it connects:** [DB01](/metrics/#db01-weekly-quality-value-accounts) · [Return to Choose the customer outcome](#stop-value)
**Useful companion views:** [Read Q01](#chart-Q01) · [Read Q15](#chart-Q15)
**Exact example scope:** Explorer: quality definition; persona/workflow all; full frozen snapshot. Rows: 5. Frozen cutoff: 2026-10-23 00:00 UTC. Proposed definitions; synthetic calculation or planning records only.
[Open saved question on this Mac](http://127.0.0.1:3000/question/343?definition=quality&persona=all&workflow=all) · [Chart/table SVG](/downloads/lab/relationship/N03.svg) · [Full CSV](/downloads/lab/relationship/N03.csv) · [Exact SQL](/downloads/metabase/relationship_lab/N03.sql)
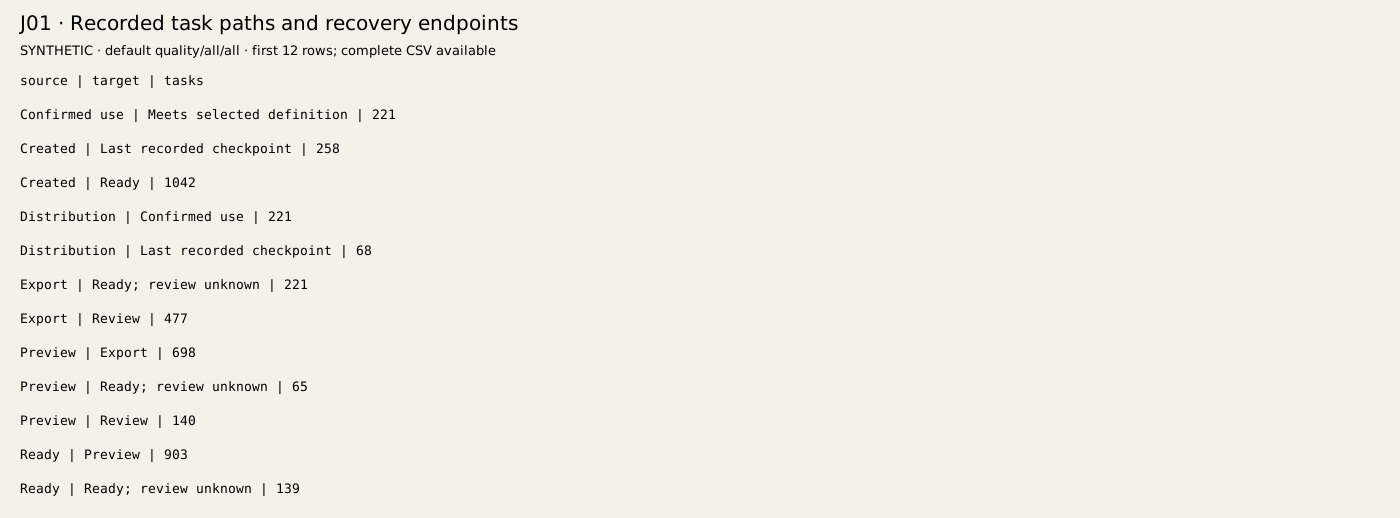
### J01 · Recorded task paths and recovery endpoints
**Decision:** What paths do tasks take when checkpoints are optional or parallel?
**Finding in this fictional example:** The flow uses actual timestamp order and retains direct links when intermediate events are absent.
**Caveat:** The flow excludes before-creation timestamps; it does not fabricate intermediate events or infer abandonment.
**Action / next evidence:** Choose one endpoint and inspect J02 plus its Q15 records.
**Say, then stop:**
> I would follow the observed path and ask what is unrecorded before turning a diagram into a product diagnosis.
**How it connects:** [DB03](/metrics/#db03-task-milestone-counts) · [DB11](/metrics/#db11-failure-recovery-to-value) · [Return to Find the limiting handoff](#stop-journey)
**Useful companion views:** [Read Q02](#chart-Q02) · [Read Q08](#chart-Q08) · [Read Q24](#chart-Q24)
**Exact example scope:** Explorer: quality definition; persona/workflow all; full frozen snapshot. Rows: 14. Frozen cutoff: 2026-10-23 00:00 UTC. Proposed definitions; synthetic calculation or planning records only.
[Open saved question on this Mac](http://127.0.0.1:3000/question/344?definition=quality&persona=all&workflow=all) · [Chart/table SVG](/downloads/lab/relationship/J01.svg) · [Full CSV](/downloads/lab/relationship/J01.csv) · [Exact SQL](/downloads/metabase/relationship_lab/J01.sql)
### J02 · Chronology, missing review and recovery audit
**Decision:** Is the task flow trustworthy enough to act on?
**Finding in this fictional example:** The full snapshot has zero before-creation chronology exclusions, 425 ready outputs without review, 193 tasks with a failed attempt and six recovered quality-use tasks.
**Caveat:** Zero chronology exclusions does not establish complete instrumentation. The snapshot has more tasks than the operational default.
**Action / next evidence:** Check review coverage and failure classes before comparing technical recovery with customer value.
**Say, then stop:**
> The audit tells me the bigger uncertainty is missing quality evidence and recovery-to-value, not a proven timestamp defect.
**How it connects:** [DB07](/metrics/#db07-preview-review-coverage) · [DB11](/metrics/#db11-failure-recovery-to-value) · [Return to Find the limiting handoff](#stop-journey)
**Useful companion views:** [Read Q06](#chart-Q06) · [Read Q08](#chart-Q08)
**Exact example scope:** Explorer: quality definition; persona/workflow all; full frozen snapshot. Rows: 1. Frozen cutoff: 2026-10-23 00:00 UTC. Proposed definitions; synthetic calculation or planning records only.
[Open saved question on this Mac](http://127.0.0.1:3000/question/345?definition=quality&persona=all&workflow=all) · [Chart/table SVG](/downloads/lab/relationship/J02.svg) · [Full CSV](/downloads/lab/relationship/J02.csv) · [Exact SQL](/downloads/metabase/relationship_lab/J02.sql)

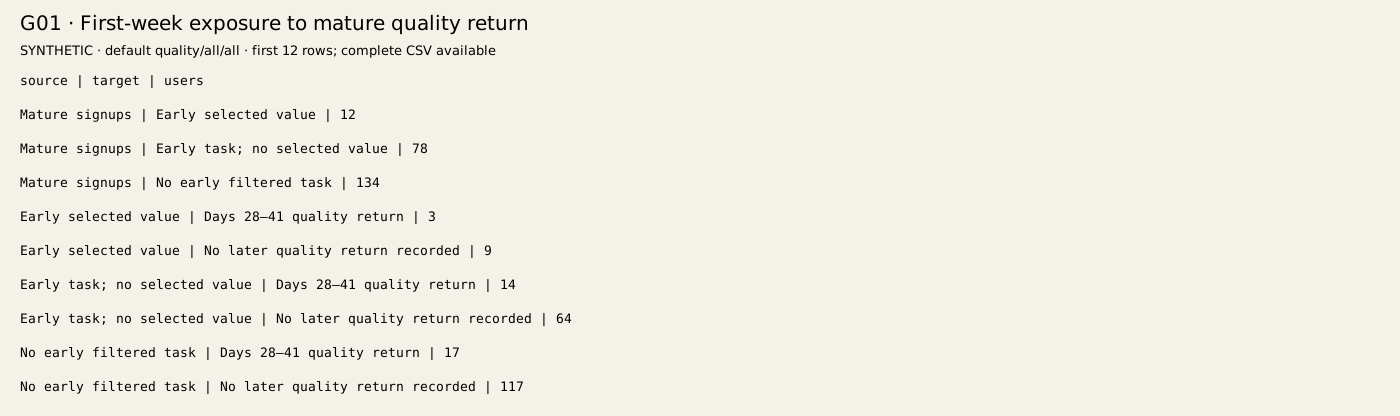
### G01 · First-week exposure to mature quality return
**Decision:** How does early exposure connect to later value?
**Finding in this fictional example:** Of 224 mature signups, 12 have early selected value, 78 have an early task without it and 134 have no early filtered task.
**Caveat:** Workflow filters first-week exposure only. Later quality return includes any workflow and all mature persona signups remain eligible.
**Action / next evidence:** Compare later return without removing the no-task group.
**Say, then stop:**
> I would keep the entire mature signup cohort visible so that an attractive early-user result does not hide everyone who never started.
**How it connects:** [DB05](/metrics/#db05-seven-day-confirmed-value-activation) · [DB06](/metrics/#db06-days-2841-confirmed-value-return) · [Return to Connect activation to repeat value](#stop-return)
**Useful companion views:** [Read Q03](#chart-Q03) · [Read Q04](#chart-Q04) · [Read Q05](#chart-Q05)
**Exact example scope:** Explorer: quality definition; persona/workflow all; full frozen snapshot. Rows: 9. Frozen cutoff: 2026-10-23 00:00 UTC. Proposed definitions; synthetic calculation or planning records only.
[Open saved question on this Mac](http://127.0.0.1:3000/question/346?definition=quality&persona=all&workflow=all) · [Chart/table SVG](/downloads/lab/relationship/G01.svg) · [Full CSV](/downloads/lab/relationship/G01.csv) · [Exact SQL](/downloads/metabase/relationship_lab/G01.sql)
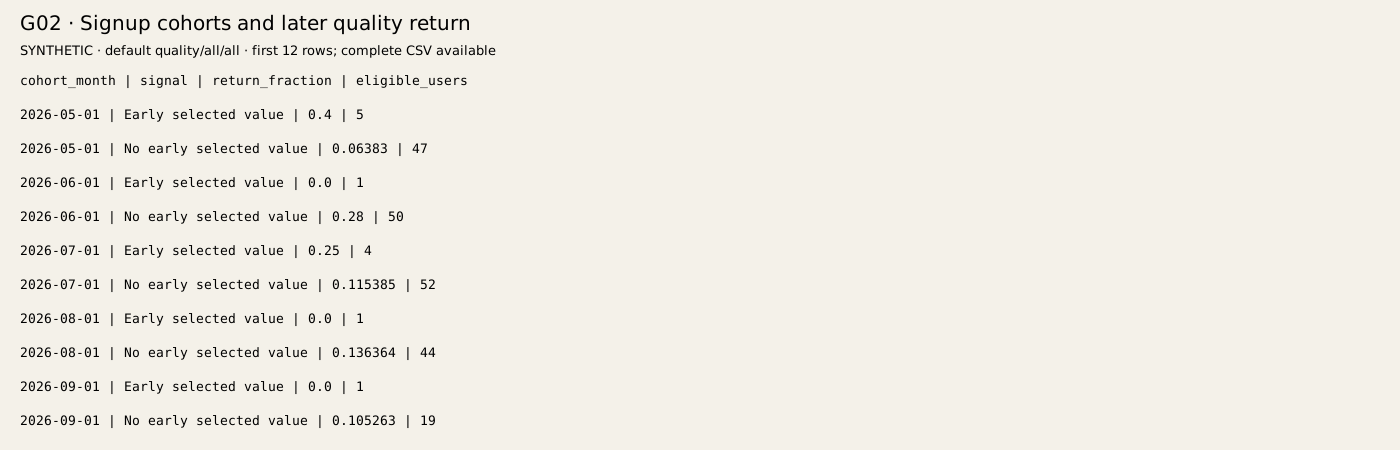
### G02 · Signup cohorts and later quality return
**Decision:** Does the early-value pattern persist within signup months?
**Finding in this fictional example:** The August early-value group has one eligible user and no later return; the other August group has 44 users and six returns.
**Caveat:** Monthly grouping reduces one source of mix differences; it does not remove confounding or fix tiny cells.
**Action / next evidence:** Read G03 denominators alongside the lines and compare another mature cohort.
**Say, then stop:**
> I would not tell a retention success story from a line chart whose key segment contains one person.
**How it connects:** [DB05](/metrics/#db05-seven-day-confirmed-value-activation) · [DB06](/metrics/#db06-days-2841-confirmed-value-return) · [Return to Connect activation to repeat value](#stop-return)
**Useful companion views:** [Read Q03](#chart-Q03) · [Read Q04](#chart-Q04) · [Read Q05](#chart-Q05)
**Exact example scope:** Explorer: quality definition; persona/workflow all; full frozen snapshot. Rows: 10. Frozen cutoff: 2026-10-23 00:00 UTC. Proposed definitions; synthetic calculation or planning records only.
[Open saved question on this Mac](http://127.0.0.1:3000/question/347?definition=quality&persona=all&workflow=all) · [Chart/table SVG](/downloads/lab/relationship/G02.svg) · [Full CSV](/downloads/lab/relationship/G02.csv) · [Exact SQL](/downloads/metabase/relationship_lab/G02.sql)
### G03 · Cohort counts and uncertainty
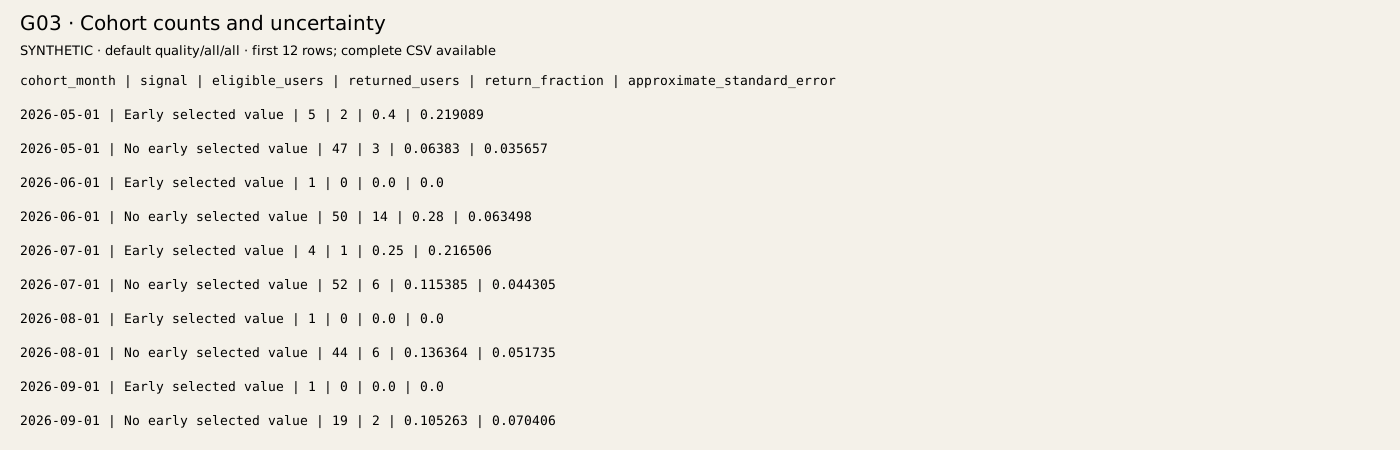
**Decision:** How much confidence can we place in the cohort percentages?
**Finding in this fictional example:** A one-user group with zero returns has a stored approximate standard error of zero.
**Caveat:** A zero plug-in standard error at 0/1 is a mathematical artifact, not certainty. Account clustering further weakens simple independence assumptions.
**Action / next evidence:** Use a suitable small-sample interval, such as Wilson, and collect more eligible users before deciding.
**Say, then stop:**
> I would lead with the count and flag that the zero error bar is misleading for a one-user segment.
**How it connects:** [DB06](/metrics/#db06-days-2841-confirmed-value-return) · [Return to Connect activation to repeat value](#stop-return)
**Useful companion views:** [Read Q04](#chart-Q04) · [Read Q05](#chart-Q05)
**Exact example scope:** Explorer: quality definition; persona/workflow all; full frozen snapshot. Rows: 10. Frozen cutoff: 2026-10-23 00:00 UTC. Proposed definitions; synthetic calculation or planning records only.
[Open saved question on this Mac](http://127.0.0.1:3000/question/348?definition=quality&persona=all&workflow=all) · [Chart/table SVG](/downloads/lab/relationship/G03.svg) · [Full CSV](/downloads/lab/relationship/G03.csv) · [Exact SQL](/downloads/metabase/relationship_lab/G03.sql)
### G04 · Early task bands versus later return
**Decision:** Is more first-week activity associated with later return?
**Finding in this fictional example:** The zero-task band has 134 users, while the four-plus-task band has only two and no later return.
**Caveat:** Each point is an aggregate band. More tasks may reflect difficulty or repeated repair, and correlation may be confounded.
**Action / next evidence:** Inspect individual rows and job frequency before prescribing more activity.
**Say, then stop:**
> I would not optimize task count simply because it is easy to increase; the outcome is repeated quality work.
**How it connects:** [DB06](/metrics/#db06-days-2841-confirmed-value-return) · [Return to Connect activation to repeat value](#stop-return)
**Useful companion views:** [Read Q04](#chart-Q04) · [Read Q05](#chart-Q05)
**Exact example scope:** Explorer: quality definition; persona/workflow all; full frozen snapshot. Rows: 4. Frozen cutoff: 2026-10-23 00:00 UTC. Proposed definitions; synthetic calculation or planning records only.
[Open saved question on this Mac](http://127.0.0.1:3000/question/349?definition=quality&persona=all&workflow=all) · [Chart/table SVG](/downloads/lab/relationship/G04.svg) · [Full CSV](/downloads/lab/relationship/G04.csv) · [Exact SQL](/downloads/metabase/relationship_lab/G04.sql)

### G05 · Weekly early signal and later outcome
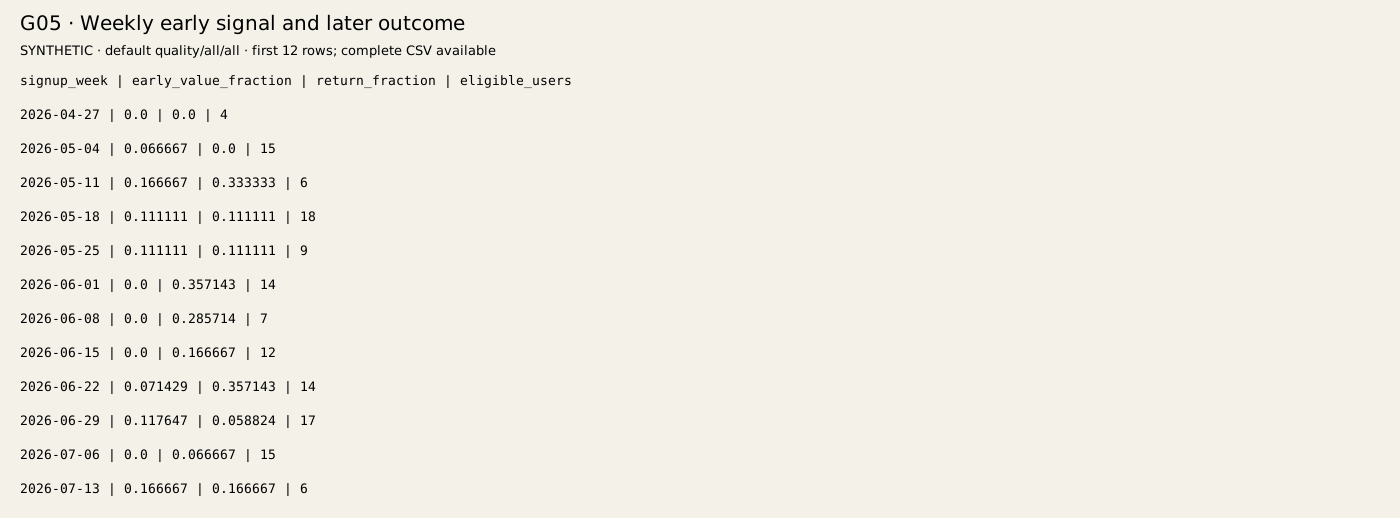
**Decision:** Do early and later signals move together across comparable cohorts?
**Finding in this fictional example:** Both weekly lines use the same mature signup-week users and expose eligible counts.
**Caveat:** Shared time trends and partial edge weeks can produce a pattern without a causal relationship.
**Action / next evidence:** Look for repeatable patterns, then check acquisition/persona mix and the held-out result.
**Say, then stop:**
> I would use this trend to generate a hypothesis, then test it on a later cohort before using it to steer the roadmap.
**How it connects:** [DB05](/metrics/#db05-seven-day-confirmed-value-activation) · [DB06](/metrics/#db06-days-2841-confirmed-value-return) · [Return to Connect activation to repeat value](#stop-return)
**Useful companion views:** [Read Q03](#chart-Q03) · [Read Q04](#chart-Q04) · [Read Q05](#chart-Q05)
**Exact example scope:** Explorer: quality definition; persona/workflow all; full frozen snapshot. Rows: 20. Frozen cutoff: 2026-10-23 00:00 UTC. Proposed definitions; synthetic calculation or planning records only.
[Open saved question on this Mac](http://127.0.0.1:3000/question/350?definition=quality&persona=all&workflow=all) · [Chart/table SVG](/downloads/lab/relationship/G05.svg) · [Full CSV](/downloads/lab/relationship/G05.csv) · [Exact SQL](/downloads/metabase/relationship_lab/G05.sql)
### G06 · Held-out signal calibration
**Decision:** Are predicted return rates calibrated on unseen users?
**Finding in this fictional example:** The early-value group predicts 30% return but has one held-out user and zero returns. The other group has 44 held-out users.
**Caveat:** Training uses earlier complete mature signup months; the latest complete mature month is held out. Tiny segments are unstable.
**Action / next evidence:** Keep the sparse group visible and inspect G07's baseline comparison.
**Say, then stop:**
> I would not operationalize a forecast whose most interesting held-out segment contains one person.
**How it connects:** [DB06](/metrics/#db06-days-2841-confirmed-value-return) · [Return to Challenge the apparent success story](#stop-evidence)
**Useful companion views:** [Read Q04](#chart-Q04) · [Read Q05](#chart-Q05)
**Exact example scope:** Explorer: quality definition; persona/workflow all; full frozen snapshot. Rows: 2. Frozen cutoff: 2026-10-23 00:00 UTC. Proposed definitions; synthetic calculation or planning records only.
[Open saved question on this Mac](http://127.0.0.1:3000/question/351?definition=quality&persona=all&workflow=all) · [Chart/table SVG](/downloads/lab/relationship/G06.svg) · [Full CSV](/downloads/lab/relationship/G06.csv) · [Exact SQL](/downloads/metabase/relationship_lab/G06.sql)

### G07 · Held-out prediction versus training base rate
**Decision:** Does the signal actually improve prediction over a simple baseline?
**Finding in this fictional example:** On the same 45 held-out users, signal Brier error is 0.117468 versus baseline 0.116467; the difference favors the baseline.
**Caveat:** Brier error is the average squared gap between a predicted probability and the actual 0-or-1 outcome; lower is better. Predictive accuracy is distinct from intervention impact. These fictional results are not company performance.
**Action / next evidence:** Retain the simpler forecast and investigate a better-defined signal on new held-out evidence.
**Say, then stop:**
> This signal does not beat the base-rate forecast in the practice data, so I would not claim predictive lift or causal improvement.
**How it connects:** [DB06](/metrics/#db06-days-2841-confirmed-value-return) · [Return to Challenge the apparent success story](#stop-evidence)
**Useful companion views:** [Read Q04](#chart-Q04) · [Read Q05](#chart-Q05)
**Exact example scope:** Explorer: quality definition; persona/workflow all; full frozen snapshot. Rows: 1. Frozen cutoff: 2026-10-23 00:00 UTC. Proposed definitions; synthetic calculation or planning records only.
[Open saved question on this Mac](http://127.0.0.1:3000/question/352?definition=quality&persona=all&workflow=all) · [Chart/table SVG](/downloads/lab/relationship/G07.svg) · [Full CSV](/downloads/lab/relationship/G07.csv) · [Exact SQL](/downloads/metabase/relationship_lab/G07.sql)

### G08 · Inspect mature user evidence rows
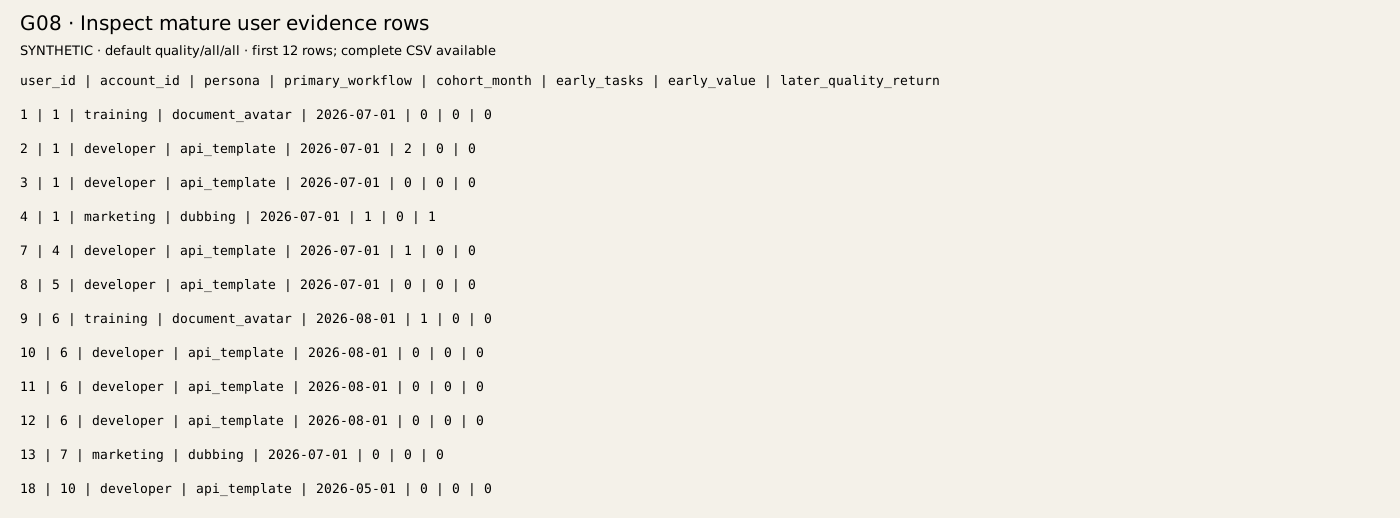
**Decision:** Can we explain the cohort denominator record by record?
**Finding in this fictional example:** The analysis table has one row for each of the 224 mature signups, including no early filtered task.
**Caveat:** No task in the selected early workflow differs from no activity anywhere. Account and user identifiers represent different units.
**Action / next evidence:** Inspect one zero-exposure and one early-value row, then return to the population view.
**Say, then stop:**
> I would use a user row to explain eligibility and exposure, then make the decision at the appropriate account or cohort level.
**How it connects:** [DB05](/metrics/#db05-seven-day-confirmed-value-activation) · [DB06](/metrics/#db06-days-2841-confirmed-value-return) · [Return to Connect activation to repeat value](#stop-return)
**Useful companion views:** [Read Q03](#chart-Q03) · [Read Q04](#chart-Q04) · [Read Q05](#chart-Q05)
**Exact example scope:** Explorer: quality definition; persona/workflow all; full frozen snapshot. Rows: 224. Frozen cutoff: 2026-10-23 00:00 UTC. Proposed definitions; synthetic calculation or planning records only.
[Open saved question on this Mac](http://127.0.0.1:3000/question/353?definition=quality&persona=all&workflow=all) · [Chart/table SVG](/downloads/lab/relationship/G08.svg) · [Full CSV](/downloads/lab/relationship/G08.csv) · [Exact SQL](/downloads/metabase/relationship_lab/G08.sql)
## Where the reusable metric library fits
The library supplies shared formulas and described dimensions. Its 27 metric-backed views do not add 27 unrelated interview stories: they are reusable versions of the definitions you just used. Open a view to inspect its source and change valid model dimensions. Keep period and unit restrictions. The registry includes DB10 as exact percentile analysis, plus DB29–DB32 as instrumentation gaps with no invented values.
| Metric | Reusable view | Decision walkthrough |
|---|---|---|
| [DB01: Weekly quality-value accounts](/metrics/#db01-weekly-quality-value-accounts) | [Open local metric view](http://127.0.0.1:3000/question/287) | [Read Q01](#chart-Q01) |
| [DB02: Confirmed quality-use tasks](/metrics/#db02-confirmed-quality-use-tasks) | [Open local metric view](http://127.0.0.1:3000/question/289) | [Read Q01](#chart-Q01) |
| [DB03: Task milestone counts](/metrics/#db03-task-milestone-counts) | [Open local metric view](http://127.0.0.1:3000/question/291) | [Read Q02](#chart-Q02) |
| [DB04: Render completion rate](/metrics/#db04-render-completion-rate) | [Open local metric view](http://127.0.0.1:3000/question/293) | [Read Q02](#chart-Q02) |
| [DB05: Seven-day confirmed-value activation](/metrics/#db05-seven-day-confirmed-value-activation) | [Open local metric view](http://127.0.0.1:3000/question/295) | [Read Q03](#chart-Q03) |
| [DB06: Days 28–41 confirmed-value return](/metrics/#db06-days-2841-confirmed-value-return) | [Open local metric view](http://127.0.0.1:3000/question/297) | [Read Q04](#chart-Q04) |
| [DB07: Preview review coverage](/metrics/#db07-preview-review-coverage) | [Open local metric view](http://127.0.0.1:3000/question/299) | [Read Q06](#chart-Q06) |
| [DB08: Reviewed acceptance](/metrics/#db08-reviewed-acceptance) | [Open local metric view](http://127.0.0.1:3000/question/301) | [Read Q06](#chart-Q06) |
| [DB09: Critical content failures](/metrics/#db09-critical-content-failures) | [Open local metric view](http://127.0.0.1:3000/question/303) | [Read Q06](#chart-Q06) |
| [DB10: Ready latency p50/p95](/metrics/#db10-ready-latency-p50p95) | Q07 exact percentile analysis | [Read Q07](#chart-Q07) |
| [DB11: Failure recovery to value](/metrics/#db11-failure-recovery-to-value) | [Open local metric view](http://127.0.0.1:3000/question/305) | [Read Q08](#chart-Q08) |
| [DB12: Task retry rate](/metrics/#db12-task-retry-rate) | [Open local metric view](http://127.0.0.1:3000/question/307) | [Read Q08](#chart-Q08) |
| [DB13: Direct vendor USD per confirmed-use task](/metrics/#db13-direct-vendor-usd-per-confirmed-use-task) | [Open local metric view](http://127.0.0.1:3000/question/309) | [Read Q09](#chart-Q09) |
| [DB14: Customer active review and repair](/metrics/#db14-customer-active-review-and-repair) | [Open local metric view](http://127.0.0.1:3000/question/311) | [Read Q10](#chart-Q10) |
| [DB15: Estimated net customer time](/metrics/#db15-estimated-net-customer-time) | [Open local metric view](http://127.0.0.1:3000/question/313) | [Read Q10](#chart-Q10) |
| [DB16: Entitlement outstanding](/metrics/#db16-entitlement-outstanding) | [Open local metric view](http://127.0.0.1:3000/question/315) | [Read Q12](#chart-Q12) |
| [DB17: Experiment assignment validity](/metrics/#db17-experiment-assignment-validity) | [Open local metric view](http://127.0.0.1:3000/question/317) | [Read Q13](#chart-Q13) |
| [DB18: Acquisition spend per activated mature user](/metrics/#db18-acquisition-spend-per-activated-mature-user) | [Open local metric view](http://127.0.0.1:3000/question/319) | [Read Q14](#chart-Q14) |
| [DB19: Mature zero-task share](/metrics/#db19-mature-zero-task-share) | [Open local metric view](http://127.0.0.1:3000/question/321) | [Read Q16](#chart-Q16) |
| [DB20: Closing subscription MRR](/metrics/#db20-closing-subscription-mrr) | [Open local metric view](http://127.0.0.1:3000/question/323) | [Read Q17](#chart-Q17) |
| [DB21: Gross revenue retention](/metrics/#db21-gross-revenue-retention) | [Open local metric view](http://127.0.0.1:3000/question/325) | [Read Q17](#chart-Q17) |
| [DB22: Net revenue retention](/metrics/#db22-net-revenue-retention) | [Open local metric view](http://127.0.0.1:3000/question/327) | [Read Q17](#chart-Q17) |
| [DB23: Full period service cash contribution](/metrics/#db23-full-period-service-cash-contribution) | [Open local metric view](http://127.0.0.1:3000/question/329) | [Read Q18](#chart-Q18) |
| [DB24: Heldout task pass by slice](/metrics/#db24-heldout-task-pass-by-slice) | [Open local metric view](http://127.0.0.1:3000/question/331) | [Read Q19](#chart-Q19) |
| [DB25: Judge failure-detection recall](/metrics/#db25-judge-failure-detection-recall) | [Open local metric view](http://127.0.0.1:3000/question/333) | [Read Q20](#chart-Q20) |
| [DB26: Engineering capacity demand](/metrics/#db26-engineering-capacity-demand) | [Open local metric view](http://127.0.0.1:3000/question/335) | [Read Q21](#chart-Q21) |
| [DB27: Unresolved release gates](/metrics/#db27-unresolved-release-gates) | [Open local metric view](http://127.0.0.1:3000/question/337) | [Read Q22](#chart-Q22) |
| [DB28: Time from creation to confirmed use](/metrics/#db28-time-from-creation-to-confirmed-use) | [Open local metric view](http://127.0.0.1:3000/question/339) | [Read Q23](#chart-Q23) |
| [DB29: Eligible payment success](/metrics/#db29-eligible-payment-success) | Requires instrumentation | [Proposed PRD measurement gaps](/prd/) |
| [DB30: Mature account paid conversion](/metrics/#db30-mature-account-paid-conversion) | Requires instrumentation | [Proposed PRD measurement gaps](/prd/) |
| [DB31: Stale approval prevention](/metrics/#db31-stale-approval-prevention) | Requires instrumentation | [Proposed PRD measurement gaps](/prd/) |
| [DB32: Confirmed unauthorized disclosure](/metrics/#db32-confirmed-unauthorized-disclosure) | Requires instrumentation | [Proposed PRD measurement gaps](/prd/) |
## Defend one recommendation in 60–90 seconds
**One-sentence answer:** “I would investigate the handoff from generated draft to approved audience use before committing to a broad creation-feature expansion.”
**Problem:** In this fictional case, render-to-ready time is measured in minutes while selected review and use records show much longer waits. The broad task cohort also has incomplete review evidence, so the exact cause remains uncertain.
**Decision/actions:** I would inspect successful and unresolved task records, observe creators and reviewers, and choose a bounded test of review ownership and version-safe approval. Engineering would validate idempotency, entitlement recovery and approval invalidation; domain reviewers would define the critical terminology cases. I would avoid declaring that lower render latency alone solved the customer's job.
**Success test — proposed:** Compare confirmed quality-use outcomes for eligible accounts, review coverage, critical errors, customer active effort and full service cost over a predefined window. Randomize at account level if collaboration creates spillover, and retain mature zero-activity accounts in the denominator. Expand only when the evidence supports the trade-off. Numerical baselines and release thresholds still need real evidence.
**STOP after the success test.** This is a hypothetical decision, not a historical SBI accomplishment. If asked “When have you done this?”, choose one real example in the [evidence map](/evidence/) and [SBI answer bank](/answers/).
## Four extraction drills
1. Read the whole map and choose only three facts for a review/recovery investment decision. Leave out company history, every feature and unrelated commercial metrics unless they change that decision.
2. Open one chart. Give one takeaway, one caveat and one action in 25 seconds. Do not recite every row.
3. Answer the question in one sentence, then use one real sourced SBI example. Keep synthetic findings separate from your work history.
4. Stop after the result or proposed success test. Wait for a follow-up.
Example practice wording, not your actual past interview: “There are eight dashboards, and first I looked at the North Star and the funnels and then the cohorts and model scores…” becomes “I would investigate the review handoff first; the current evidence points there, but I would validate coverage before choosing the fix.” The tighter version deliberately leaves out the chart inventory because it does not justify the decision.
Score relevance, prioritization, personal ownership, evidence, concision and understandable language using the guide's six-part rubric. Personal answers are blank until you practise. Save a response for each tour stop or use the chapter notes; both stay in your browser and travel in the same study-work export.
[Study sessions and ten-minute review](/practice/) · [Full data/analysis reference](/metabase-analysis/) · [Proposed PRD](/prd/) · [Sources](/sources/)